Sowing A Crop
Exercise 4: A Sorghum Crop Simulation
In this exercise you will observe the growth of a crop over a single season. You will learn a bit more about how to use APSIM to do a ‘what-if’ experiment with fertiliser rates. These skills can not only be used to experiment with fertiliser rates but also variables such as:
- Time of planting.
- Rate of sowing.
- Crop comparisons and different starting soil moisture conditions.
1. Start a new simulation using ‘Continuous Sorghum.apsim’.
2. Rename the simulation as Sorghum 0kg Fertiliser. Save the file as ‘Module4.apsim’.
3. Choose the Dalby met file and set the start and end dates of the simulation to 1/1/1988 – 30/6/1988.
4. Select the Heavy Clay soil from the Training toolbox. If you do not see this toolbox, see Module 1 to add it.
5. Set the Starting water to 25% full – filled from top.
6. Set the Starting nitrogen to 12 kg/ha of NO3 and 3 kg/ha of NH4, evenly distributed; refer to Water node to get Depth range.
7. Change the Crop Management rule to reflect the following:

By setting the sowing window start and end to the same data and changing ‘must sow’ to yes, we force the crop to be sown on that particular day. For other crops there is a specific ‘sow on a fixed date’ rule that is simpler than this one, but we’re sowing sorghum which has extra options so we need to use this one.
8. Add a ‘Fertilise at sowing’ rule, from Manager (common tasks). Set the starting fertiliser to 0 and change wheat to sorghum. We are including this rule here as it will be used later when linked simulations are introduced.
9. Report the following variables:
| Component | Variable Name | Comment |
| clock | dd/mm/yyyy as Date | |
| day | ||
| year | ||
| Soil (Heavy Clay) | dlayer | Depth – layered (mm) |
| sw | Soil water – layered (mm) | |
| sorghum | DaysAfterSowing | |
| LAI | ||
| Biomass | ||
| Yield |
Linking Simulations
Often you will find yourself making a large number of simulations that have only very minor differences between them. For example, in this exercise we will make three simulations and the only difference between them will be the amount of fertiliser used. We can easily do this by cloning the simulation then changing the fertiliser amount. But what if we later find out that we’ve used the wrong cultivar or would like to try a different starting nitrogen value or report different variables? If we’ve cloned the simulations then we would need to go through each one and change the value. This may not be such a problem if we’re only looking at three simulations like this exercise, but if we have tens or even hundreds this becomes a prohibitive task. The solution is to link simulations together so that changes made to one simulation affect all linked simulations.
1. To create a linked simulation, hold down the ALT key and drag Sorghum 0kg Fertiliser to the Simulations component at the top of the simulation tree. You should see the new simulation appear as a blue link:

This means that the two are linked. You can make changes to either simulation and it will affect the other one. There is no limit to the number of simulations that can be linked and it is possible to link from a linked simulation.
IMPORTANT: Deleting many linked simulations can be very slow as all components need to be unlinked. Do not delete more than one or two at a time or APSIM will become unresponsive.
2. Rename this copy to ‘Sorghum 30kg N Fertiliser’.
3. Right click the linked ‘Fertilise at sowing’ rule and select ‘unlink’ then ‘unlink this node’. You can now edit the rule without changing any of the other linked simulations.
4. Apply 30 kg urea_N fertiliser.
5. Make another linked copy of the simulation, this time adding 60 kg/ha of fertiliser (don’t forget to unlink the node). Call the simulation ‘Sorghum 60kg N Fertiliser’.
6. Run all 3 simulations. You can run all 3 simulations by clicking on the top simulations component, at the top, then clicking the Run button. If you just click on one of the simulation sub components (e.g. Sorghum Nil Fertiliser or any sub component under it) then click the Run button, it will only run that simulation.
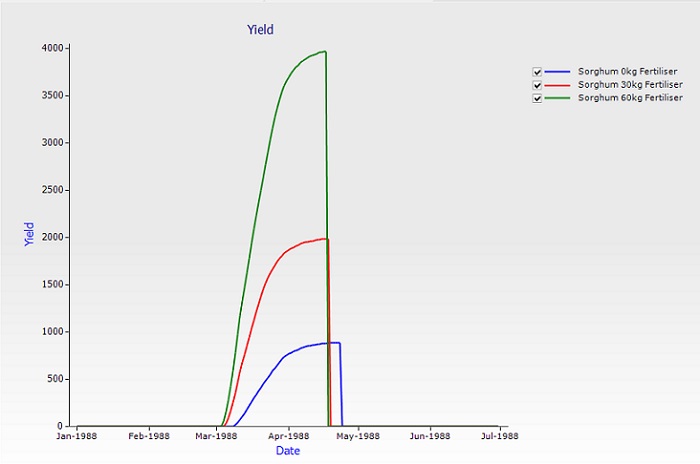
7. Graph all 3 output files creating a Date vs Yield graph using a graph component. Click on the Graph toolbox and drag an XY graph component onto the simulations component (at the top). Rename this to Yield.

