
Evaluating a cropping system
A simple cropping sequence: biomass, nitrogen and water
In this exercise you will construct time series graphs to help in the evaluation and discussion of the following key components of a rice-wheat cropping system:
1. Total above ground biomass and grain production during the season for both rice and wheat crops.
2. Soil nitrogen dynamics in response to applied fertiliser on soil nitrogen availability.
3. Soil water and ponding dynamics in response to rainfall and applied irrigation.
- Create a copy of the Rotations.apsim file and rename it to Rice-wheat system.apsim. (C:\Apsim_workshop\Rotations.apsim) Load the new APSIM file into the ApsimUI. Remove all the additional simulations except for Rice-wheat by selecting a simulation node and pressing the Delete key.
- Select the outputfile -> Variables subcomponent. Add additional variables to report:
Component Variable name Fertiliser fertiliser Silt NH4() Rice rlai as LAI(rice) Wheat wheat.lai as LAI(wheat) - Run the simulation.
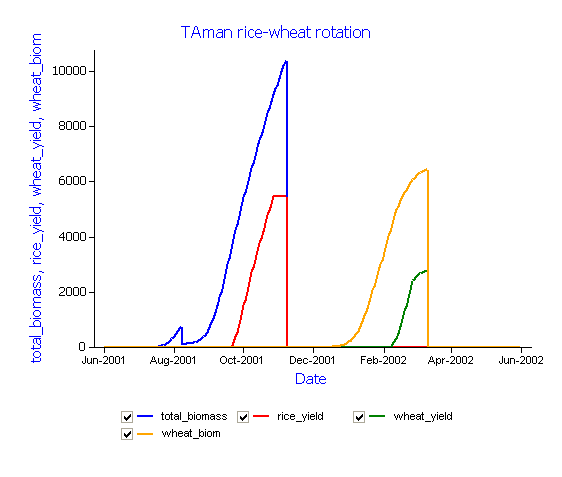 TAman rice-wheat rotation: Simulated biomass and grain yield for a transplanted “Aman” rice – wheat cropping sequence.
 - Select XY Chart1 and rename to Nitrogen.
- In the ‘Plot’ window in addition to the Y variables: no3(), NH4(1) and N_avail add nh4().
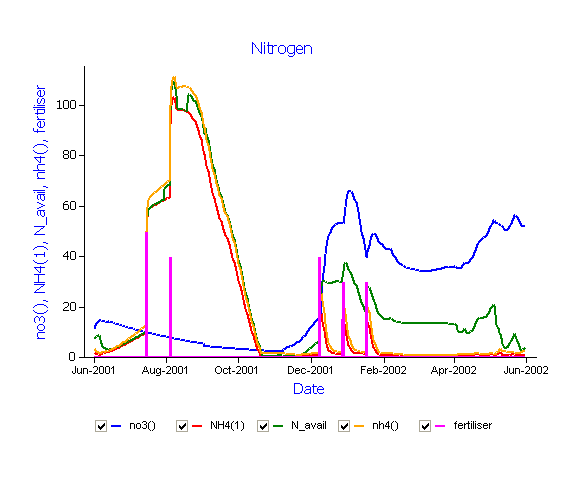 Nitrogen: Simulated soil nitrogen dynamics for a TAman rice – wheat cropping sequence.
 - Add an additional graph to your Outputfile node.
In the Y variables add the following variables: dul(1)and sw(1) on the lefthand axis. On the righthand axis add: irrigation. Create an extra plot component by dragging a ‘plot’ (from “Graph Toolbox” -> Graph -> “GraphBits (Plot)” onto the ‘Outputfile’. Add rain (Righthand axis) into the Y axis in ‘Plot1’. Change the type to Bar and select a new colour. Rename this graph to Water.
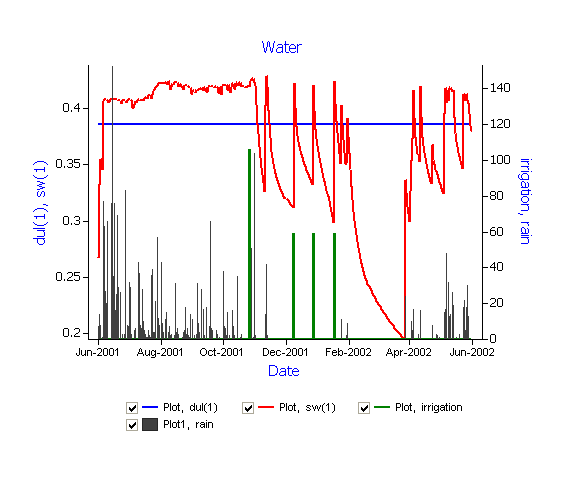 Water: Simulated period of ponding during the monsoon rice crop. Rainfall and irrigation events occuring over the rice – wheat cropping season.
 - Create a graph of Leaf Area Index (LAI) for the rice and wheat crops. Plot LAI(rice) and LAI(wheat) on the Y axis. Add a second ‘Plot’ component (Hint: See documentation above for the water graph on adding a plot component) with Y variables: total_biomass and wheat_biom (right axis). Rename this graph to LAI.Notes:
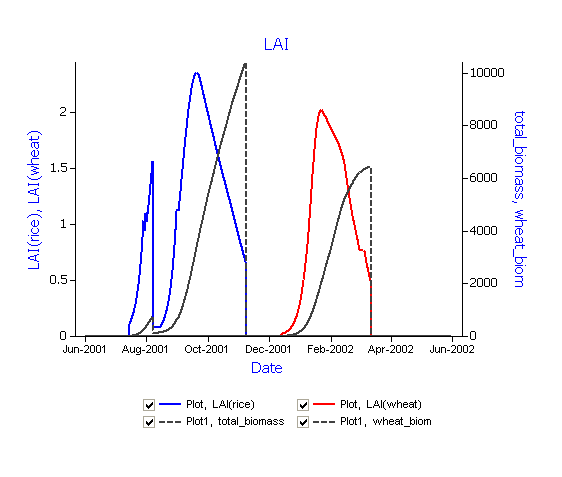 LAI: Simulated Leaf Area Index (LAI) for rice and wheat. Plant biomass is also included.