Single season crop simulations
In this exercise we will simulate the biomass and yield of a direct-seeded rice crop using APSIM-ORYZA.
You will learn a bit more about specifying a Manager template, execute more than one run in batch mode and use the simulator to do a “what-if” experiment with fertiliser rates and type. These skills can also be used to “experiment” with time of planting, rate of sowing and different irrigation rates.
- Start a fresh simulation using Oryza as a template
- Select the first example Rice to use for this simulation (delete the second example:’Ponding simulation’ for the moment)
- Choose the Bhola_1998-07.met weather file
- Set the clock starting date: 1/1/2001, Ending date: 31/12/2001
- Add a soil to the field node (“North Joynags-06 No673”)
- From Soils toolbox, find and drag a “Southern Bangladesh, Bhola district Silt, (Wheat PAWC = 138.5 mm, 1.5m)” soil description onto the field node of the simulation tree, (located under Soils –> Bangladesh –> Southern Bangladesh –> Bhola –> Silt (North Joynags-06 No673)) removing the existing soil description after the addition. Rename the soil to something short like Silt. If you like you can also reorder the soil component so it comes straight under the field.
- Set the Starting water to 100% full – filled from top.
- Set the Starting nitrogen to 10 kg/ha of NO3 (as 6 and 4 in each layer, respectively) and 5 kg/ha (4 + 1) of NH4
- Drag a Surface Organic Matter componet from Toolbox – Soil related onto your paddock.
- Select the Surface Organic Matter component for editing: Organic Matter pool name: rice_stubble.
Surface organic matter type: rice.
Initial surface residues: 0. - In the Irrigation component set Automatic irrigation to off.
- Drag a fertiliser component from the toolbox onto your paddock. (You may want to reorder components above the output file)
- In the Manager component, delete the Rice sowing rule. Drag a Rice-Direct seeding component from the Rice Management Toolbox into the Manager.
- Change the sowing rule to:
set sowing window START to 1-Jul
set sowing window END to 1-Jul
set Cultivar to local
set number of plants per seedbed to 180 - Choose these variables to report:
Component Variable name Clock dd/mm/yyyy as Date Year Day Soil (Silt) ESW NO3() as no3_tot Rice cropsta as crop_stage dae wagt as total_biomass wso as storage_organs wrr as rice_yield (Variable not in drop down) tnsoil as N_avail - Choose an “end_day” reporting frequency.
- Rename the simulation to Direct_seeded_rice.
- Save the simulation file as Rice single season.apsim (C:\Apsim_workshop\Rice single season.apsim)
- Run the Direct_seeded_rice simulation
- Graph total_biomass and rice_yield with an XY graph with Date on the X axis. (Drag or Insert the XY graph on the top simulation node to plot output from both simulations)
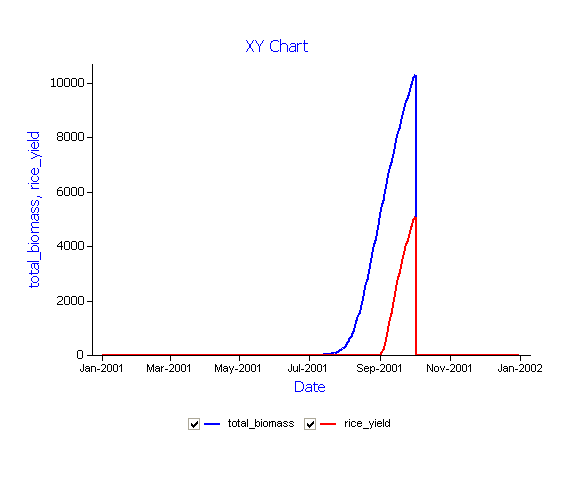 This simulation demonstrates a local rice variety (direct seeded) grown under rainfed conditions during the monsoon. Simulated rough rice yield and biomass indicate a favourable season for rainfall. Investigate the rainfall during the growing season by reporting additional variables.
 - Add additional report variables:
Component Variable name Met rain Soil (Silt) DUL(1) sw(1) no3() nh4() drain Irrigation irrigation - Rerun simulation
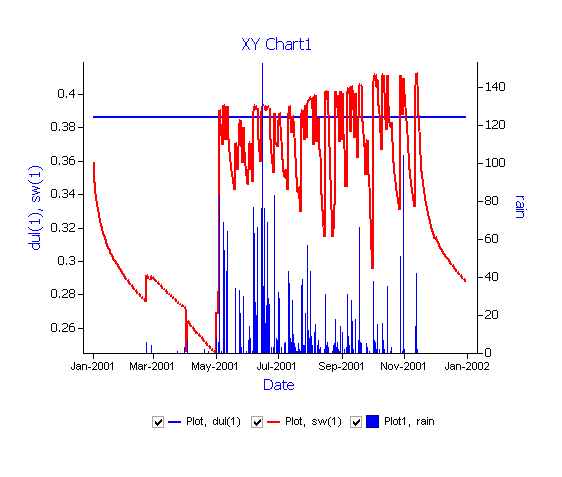
- Create a new graph by copying your XY chart onto the ‘Outputfile’. Copy ‘Plot’ onto this XY Chart1 to create a second Plot1. For Plot select Y variables dul(1) and sw(1) (solid line and no points). For ‘Plot1’ select rain (right hand axis and type= Bar).
 This graph shows volumetric soil water levels (sw(1) in mm/mm) in the top layer compared with the drained upper limit(DUL)in layer 1. Soil water in the surface layer is effected by soil evaporation (decline in SW(1) during the drier winter months of January to March) while surface water occurs only during the high rainfall period of the monsoon.
Single season transplanted rice crop under ponded conditions
In this exercise we will simulate the growth and yield response of transplanted paddy rice. Apply fertiliser at defined stages in crop development and apply irrigaton as required to maintain adequate water levels in a paddy.
- Make a copy of the simulation Direct_seeded_rice by dragging it to the Simulations node at the top of the simulation tree.
- Rename this copy to Transplanted_paddy_rice.
- Delete the Rice-Direct seeding manager from the Manager folder
- Drag Pond_depth on to the Manager Folder (from “Rice Management Toolbox” -> Rice-> “Manager (Pond_depth)”
- Change properties to:
Name of your soil module: Silt
Start date for ponding: 1-Jun (Start of wet season – bunds constructed)
End date for ponding: 30-Oct (Crop maturing – open bunds) Maximum depth of pond: 150
Minimum depth of pond: 50 (Note: This is the trigger for irrigation to be applied)
Enable irrigation : No (set to No irrigation for the momemt)
Start date for irrigation: 1-Jul
End date for irrigation: 30-Oct
Maximum number of irrigations allowed: 6 - Edit your soil file properties – Water – KS. (hydraulic conductivity in mm/day)to:
Component Variable name Depth KS 0-15 24 15-30 24 30-60 24 60-90 24 90-120 24 120-150 1 - Drag Rice-Transplant Aman on to the Manager Folder (from “Rice Management Toolbox” -> Rice-> “Manager (Rice-Transplant Aman)”
- Change properties to:
Enter sowing window START date: 1-Jul
Enter sowing window END date: 1-Jul
Duration of seedbed: 25
Number of plants on hills: 2
Fertiliser type: urea_N
Amount of fertiliser at transplant: 30 - Save the file
- Drag Fertilise on growth stage on to the Manager Folder (from “Rice Management Toolbox” -> Rice-> “Manager (Fertilise on growth stage)”
- Change properties to:
Amount of fertiliser to apply: 40
Fertiliser type: urea_N - Drag a Rice residue on to the Manager Folder (from “Rice Management Toolbox” -> Rice-> “Manager (Rice residue)
- Change properties to:
Select your module to apply tillage : Surface Organic Matter
Tillage type: user_defined
Depth of seedbed preparation: 0
Fraction to incorporate: 0.85 - Run Transplanted_paddy_rice simulation
Create an XY graph of Biomass and rice yield (XY chart copied with this simulation from Direct_seeded_rice should be correct)
 The graph shows daily biomass development from seedling establishment until day (25) of transplant (specified by “Duration of seedbed” in manager rules for sowing). Biomass is reduced due to transplant shock before developing total biomass at maturity. Grain fill starts in the second week in September and reaches full grain yield at physiological maturity in the last week of October.
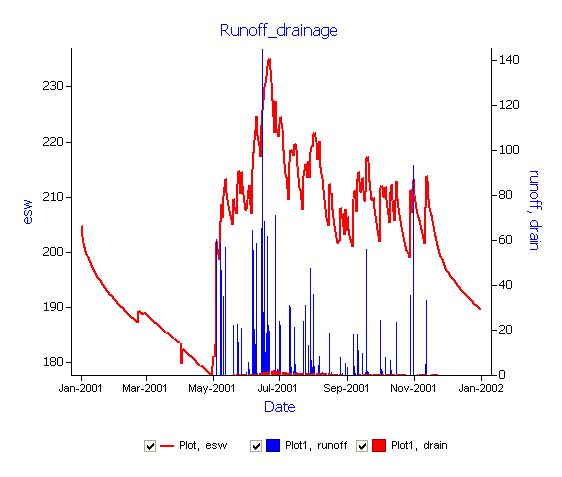
Create a second XY graph using Plot by dragging it onto your ‘Outputfile’. Graph dul(1) and sw(1) on the left axis with rainfall and drainage (Cumulative) on the right hand axis.