
Single season crop simulations
In this exercise we will simulate the growth and yield of maize and cowpea in the same season with identical starting conditions and compare their growth and water use.
You will learn a bit more about specifying a Manager template, execute more than one run in batch mode and use the simulator to do a “what-if” experiment with fertiliser rates and type. These skills can also be used to “experiment” with time of planting, rate of sowing, crop comparisons and different starting soil moisture conditions.
- Start a fresh simulation using Continuous Sorghum as a template
- Choose the Kakamega2010 weather
- Clock Starting date: 1/9/2010, Ending date: 31/12/2010
- Select the “Chromic Luvisol, Katumani Research Station (PAWC = 164mm)” (International toobox->Kenya). Rename the soil to Luvisol_164mm
- Set the Starting water to 75% full – filled from top.
- Set the Starting nitrogen to 20 kg/ha of NO3 (as 12 and 8 in each layer, respectively) and 5 kg/ha (4 + 1) of NH4
- Drag Maize module onto the simulation paddock (from Standard Toolbox-> Crops) and delete the sorghum module
- In the Surface Organic Matter component, set initial surface residues to none, change surface organic matter type and pool to maize, and set initial surface residue to 0 kg/ha.
- In the Manager component, delete the Sowing fertiliser (we will not add fertilizer in this simulation) and the Sorghum Sowing rule.
- Drag “Sow on a fixed date” into the Manager component (from Standard Toolbox -> Management -> “Manager (common tasks)”
- Change the sowing rule to:
set sowing date to 5-Sep.
set name of crop to maize.
set sowing density to 4.4
set sowing depth (mm) to 30
set cultivar to katumani
set crop growth class to plant
set row spacing to 0.9 (NB. The maize module interprets the units here as metres, not millimetres, which can be confusing) - Check that the ‘harvest rule’ node indicates that maize should be harvested.
- Choose these variables to report:
Component Variable name Clock dd/mm/yyyy as Date Year Day Soil ESW NO3() as no3_tot Maize daysaftersowing as Mz_das lai as Mz_lai yield as Mz_grn biomass as Mz_tbm biomass_n as Mz_Nuptk - Choose an end_day reporting frequency.
- Rename the simulation to Maize_0N_SR2010.
- Save the simulation file as Crops_single_season.apsim
- Make a copy of the simulation by dragging Maize_0N_SR2010 node to the Simulations node at the top of the simulation tree.
- Rename this copy to Cowpea_SR2010.
- Drag a Cowpea module onto the simulation paddock (from Standard Toolbox-> Crops) and delete the maize module
- Change the sowing rule to: set name of crop to cowpea
set sowing density to 5
set cultivar to banjo
set row spacing to 900 (mm)
leave all the other parameters as they are - Check that the ‘harvest rule’ node indicates that cowpea should be harvested.
- Choose these variables to report:
Component Variable name Clock dd/mm/yyyy as Date Year Day Soil ESW NO3() as no3_tot cowpea daysaftersowing as Cp_das lai as Cp_lai yield as Cp_grn biomass as Cp_tbm biomass_n as Cp_Nuptk - Save the simulation file
- Run the Maize and Cowpea simulations for the Short rains 2010 season.
- Plot Mz_tbm, Mz_grn, Cp_tbm and Cp_grn with an XY graph with Date on the X axis. (Drag or Insert the XY graph on the top simulation node to plot output from both simulations)
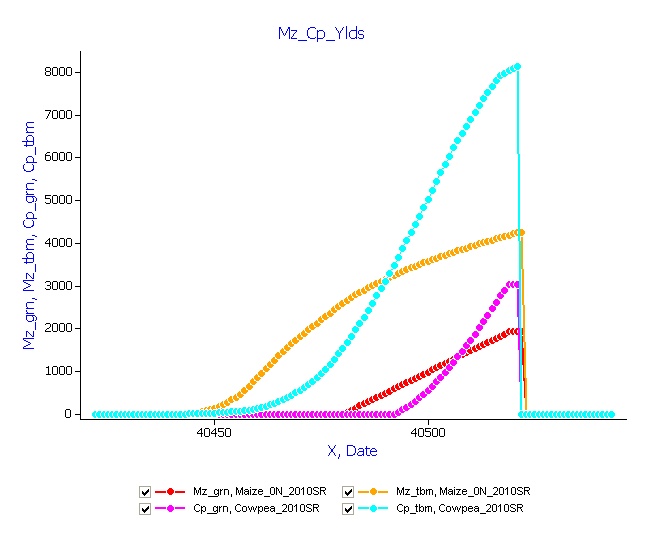
The initial growth of cowpea is much less than that of maize, but final biomass and grain yield of cowpea is much higher than the maize. Let’s examine the effects of the different crop growth patterns on soil resources.
- Plot esw and no3_tot on an XY graph (again put XY graph onto the top node Simulations).
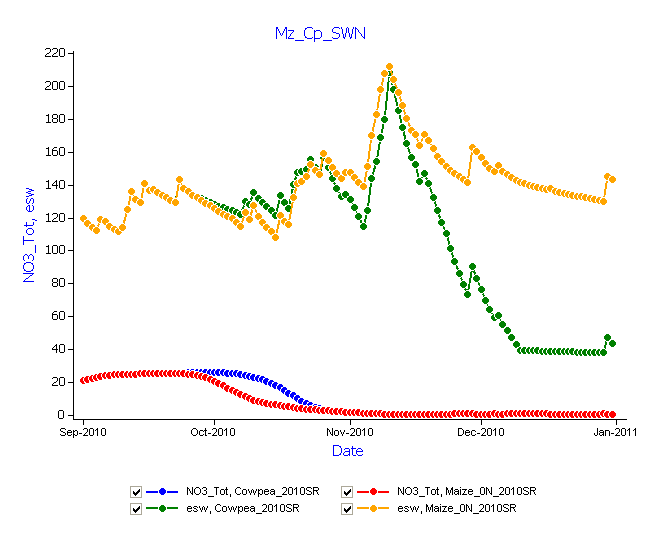
Higher initial levels of soil NO3-N are reduced to near zero for both cowpea and maize in the Oct/Nov period. However, the cowpea crop uses more esw in Nov and Dec compared to the maize and this is consistent with its higher biomass production. What explains the higher water use by the cowpea relative to the maize?
Response of maize to organic and inorganic N inputs
In this exercise we will simulate the growth and yield response of maize to nitrogen inputs as fertiliser and manure for a single season (2010SR).
- Make a copy of the simulation Maize_0N_SR2010 by dragging it to the Simulations node at the top of the simulation tree.
- Rename this copy to Maize_50N_SR2010.
- Drag Fertilise at sowing on to the Manager Folder (from “Standard Toolbox” -> Management-> “Manager (common tasks)”
- Change properties to:
set module event to come from maize
set module event to sowing
set module to apply to fertiliser
set amount to 50 (kg/ha)
set type to NH4NO3 - Save the file
- Make a copy of the simulation Maize_50N_SR2010 by dragging to the Simulations node at the top of the simulation tree.
- Rename this copy to Maize_50Nmanure_SR2010.
- Drag Manure on fixed date AND Manure at sowing onto Manager (These templates are found in “Standard toolbox” -> Management-> “African and Indian specialisations” -> “Phosphorus and Manure” )
- Drag Tillage on a fixed date onto Manager
- Remove Fertilise at sowing from Manager
- For Manure on fixed date, set date to 1-Sep, amount = 2500 kg/ha, type = manure, CNR = 8 and CPR = 50.
- For Manure at sowing, set ‘event from’ to maize, amount = 2500 kg/ha, type = manure, CNR = 8 and CPR = 50. (Note: By default, SurfaceOM type = manure is 8%C in the standard apsim release. At CNR = 8, %N is 1%. This has been chosen so as to apply 25 kgN/ha at each application. This makes the total N applied equal to the fertilised treatment)
- For Tillage on fixed date, set date = 5-sep, Module used = surface organic matter, Tillage Type = user_defined, depth = 100mm, fraction incorporation = 1.0
- Save the file
- Run both simulations
- Create a XY chart of Mz_grn and Mz_tbm for the three simulations; Maize_0N_SR2010, Maize_50N_SR2010, and Maize_50Nmanure_SR2010
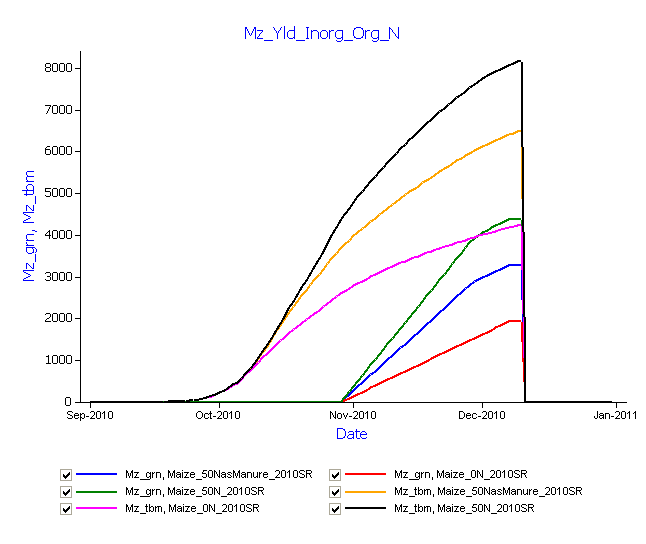
The plot shows that the simulated maize biomass and grain yield is highest for N applied as fertiliser. The response to N applied as manure is smaller by comparison, roughly 25% less than the response achieved with fertiliser N.
Examine the effects of the different N inputs on soil resources.
- Plot no3_tot and esw vs date
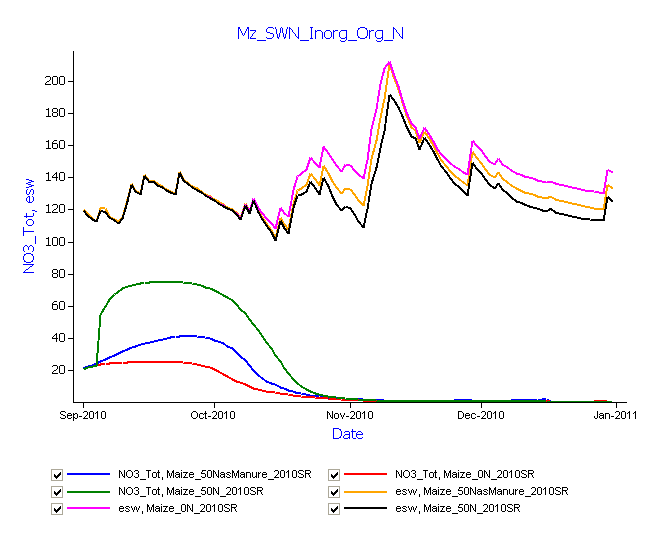
There is a rapid increase in soil no3 levels after application of the NH4NO3 and with nitrification taking place. Even so, the amount of NO3-N in the profile is depleted by crop uptake with time and approaches zero during the early stage of grain filling.
The manure input does not increase the NO3 level much beyond the zero treatment during the whole cropping period.
The fertilised maize reduces the esw to lower levels than either of the manure or N0 treatments, however there is still insufficient N in the system to utilise all of the available soil moisture in this particular season.