Maize-Legume crop simulations
Maize-Groundnut rotation
In this exercise you will use sowing rules to plant groundnut and maize crops in rotation over a 10 year period without resetting water or nitrogen at sowing.
- Start a new simulation using Maize Legume and Weeds Rotation as a template
- Choose the Embu 2000-2010 weather
- Set clock to run from 1/9/2000 to 1/9/2010
- Select the “Machanga” soil (International soils toolbox -> Kenya)
- This soil doesn’t have crop lower limits for peanut, so add a new crop to the soil. Make sure you call it peanut. For this exercise, instead of changing LL, PAWC, KL and XF values just leave the default values. If you do not know how to add a new crop see the following document: Adding crop properties to a soil.Note that the ‘xf’ parameter for both crops in the bottom two soil layers is set to zero. This indicates that crop roots will not grow into these soil layers (due to chemical or physical barriers) and therefore the soil water and nutrients are unavailable for crop uptake.
- Open the SoilWat node and make SummerU and WinterU = 3 (not 5). This is the 1st stage soil evaporation coefficient.
- Set the Starting water to 25% full – filled from top.
- Set the Starting nitrogen to 10 kg/ha NO3 (as 7 and 3 in each layer) and 5 kg/ha NH4 (as 4 + 1).
- Expand the Manager component and open the Rotations with Intercrop node.
- Make the following changes:
Set summer fallow = 1-mar;
winter fallow = 1-sep;
line 1 of rotation sequence = maize;
line 2 = peanut,
line 3 = nil. (‘nil’ indicates to APSIM that the rotation sequence is ended)
We will grow maize in the short rains season (Oct-Jan) and groundnut in the long rains season (Mar-Jun) - The first Sow using a variable rule with intercropping rule is already set up to plant maize. Set the following properties to:
method of cropping: sole
cultivar: katumani
sowing window start date: 10-Oct
sowing window end date: 20-Nov
must sow: no
amount of rainfall: 20
number of days of rainfall: 3
sowing density: 3
sowing depth: 50
row spacing: 0.9 (m)
amount of topdress fertiliser: 0
name of soil module: Machanga - The second sow rule (designated by {2} at end) is already set up to plant peanut. Set the following properties to:
method of cropping: sole
cultivar: chico
sowing window start date: 10-Mar
sowing window end date: 1-May
must sow: no
amount of rainfall: 20
days to accumulate rainfall: 3
sowing density: 8
sowing depth: 50
row spacing: 600 (mm)
name of soil module: Machanga - Make sure the first output at harvesting rule is set to maize and the second to peanut
- Likewise, make sure the first harvesting rule is set to maize and the second to peanut
- Set the properties of Remove residues component to 1-Mar to remove maize residues after the Short Rains crop. (95% of peanut residues are removed with the peanut harvest rule).Make a copy of the Remove residues component and set the date of this copy to 1-Sep.
The default template has provision for simulating weeds as an intercrop. We will remove weeds from the simulation.
- Delete Sow WEEDS using a variable rule with intercropping and Weeding at threshold weed biomass or maximum days from the Manager node. Also, delete the weed module from the paddock.
- Open the Canopy node. Delete “weed” from the grid box.
- Embu is a new site. It would be of interest to see how much rainfall there is in each season. As there is only reporting at harvest of maize and peanut crops, we must accumulate and store the rainfall during the cropping season for reporting. We do this using the Tracker module.Drag a Tracker component onto your paddock node (from “Standard toolbox” -> Management) and open it.
- From “Example tracker variables” (on far RHS of screen), select ‘sum of rain on start_of_day from sowing to now as RainSinceSowing’. Double click it to add it to the Tracker grid
- Choose these variables to report in the outputfile component (deleting any default variables not required):
Component Variable name Clock dd/mm/yyyy as Date Year Day Maize DaysAfterSowing Biomass Yield Biomass_n Machanga biom_n() Tracker RainSinceSowing - Rename simulation to Maize-Groundnut Rotation.
- Save the filename to Maize-Legume Crop simulations.
- Run simulation
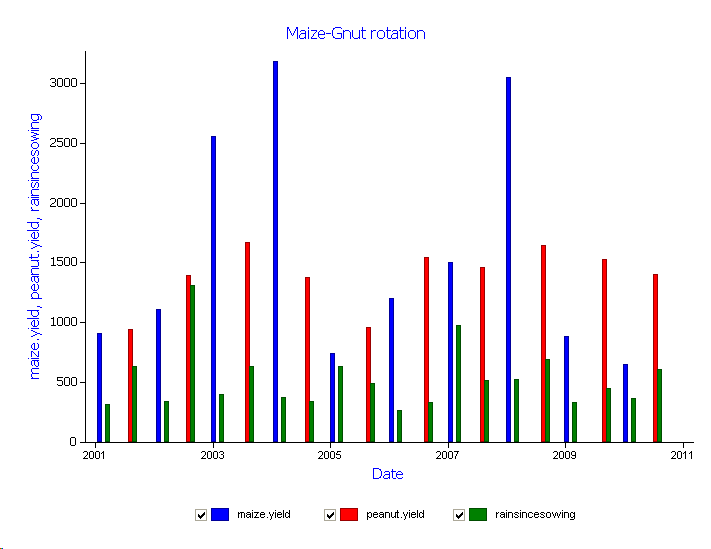
- Create a graph of Date vs. Maize and Peanut Yield and RainSinceSowing for the 10 years of simulation as a bar chart. (‘Date’ is better then ‘Year’ on the x-axis, so as to separate out the Long and Short rains yields in a given year)
- Add a Title to the graph, identifying it as Maize-Gnut rotation. To find out how to add a title to a graph see: How To Modify a Graph component.

All 10 groundnut crops in the Long rains produce grain yield, but only eight of the 10 Short rain maize crops do so. What do you think happened to the maize crops in 2001/02 and 2004/05 Short Rains?
Also note that the highest grain yields are not associated with the highest in-crop rainfall.
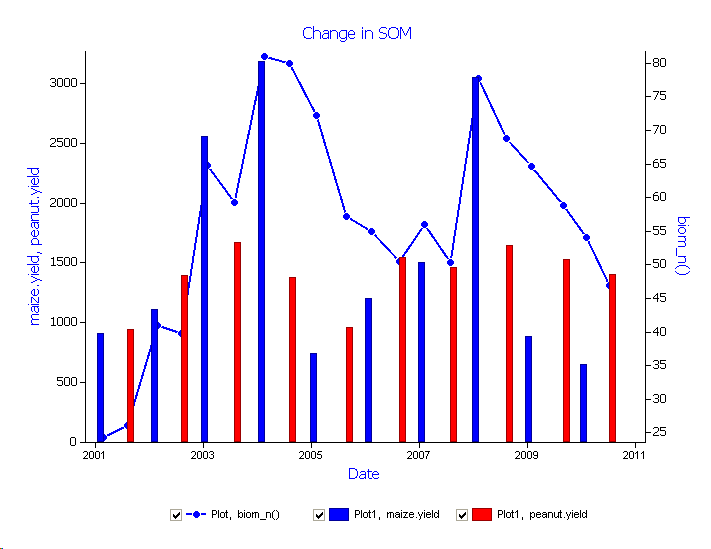
- Create a graph of Date vs. soil biom_n()(righthand axis) to see the impact of the rotation on soil organic matter. Add a bar chart for Maize and Peanut Yields as shown below. To find out how to mix line and bar charts see: How To Modify a Graph component.

To see the impact of this increase in labile SON on maize yields with a groundnut rotation, we would need to simulate maize-maize for the same conditions. See if you can set up a maize-maize sequence using the Maize-groundnut simulation as a starting point.
Maize-Groundnut intercrop
For intercropping, we will use the same climate and soil for Embu and plant maize and groundnut together in every season. However, we will need to make some adjustments to planting window and plant densities, particularly in the short rains.
- Create a copy of Maize-Groundnut Rotation and rename it to Maize_Groundnut Intercropping
- Open the Manager component and delete Rotations with Intercrop.
- Rename Sow using a variable rule with intercropping to Sow_maize_SR
- Rename Sow using a variable rule with intercropping{2} to Sow_gnut_LR
- Make a copy of Sow_maize_SR under Manager and rename it to Sow_maize_LR.
- Set properties of Sow_maize_LR to:
Method of cropping: intercrop
sowing window start date: 10-Mar
sowing window end date: 1-May - Open Sow_gnut_LR node. Change the method of cropping to intercrop, the sowing density for groundnut from 8 to 3 and the row spacing from 600 to 900 (mm) (to be consistent with the maize row configuration)
- Make a copy of Sow_gnut_LR under Manager
- Rename it to Sow_gnut_SR.
- Set properties of Sow_gnut SR to:
method of cropping: intercrop
sowing window start date: 10-Mar
sowing window end date: 1-May
sowing density: 1 - For the intercropping simulation make a copy of the outputfile node under paddock. We need to capture the yields of maize and peanut separately due to different maturity of the crops.
- Rename the first outputfile node to outputfile_mz and the second to outputfile_gn.
- Make the My Variables for outputfile_mz as below:
Component Variable name Clock dd/mm/yyyy as Date Year Day Maize Maize.DaysAfterSowing Maize.Biomass Maize.Yield Maize.Biomass_n Soil Nitrogen biom_n() Tracker RainSinceSowing - Make the My Variables for outputfile_gn as below:
Component Variable name Clock dd/mm/yyyy as Date Year Day Peanut/span> Peanut.DaysAfterSowing Peanut.Biomass Peanut.Yield Peanut.Biomass_n Soil Nitrogen biom_n() Tracker RainSinceSowing - Open the Manager folder. At the Output at harvesting for intercropping node, set “Name of Outputfile Component” to outputfile_mz using the drop down menu. Make sure the name of crop is set to maize.
- Make a copy of the Output at harvesting node and in the new node, set “Name of Outputfile Component” to outputfile_gn using the drop down menu. Make sure the name of crop is set to peanut.
- Save the simulation file.
- Run the intercropping simulation
- Drag an XY graph onto the paddock node of Maize_Gnut Intercropping. (This will allow the Graph package to see both outputfile_mz and outputfile_gn data)
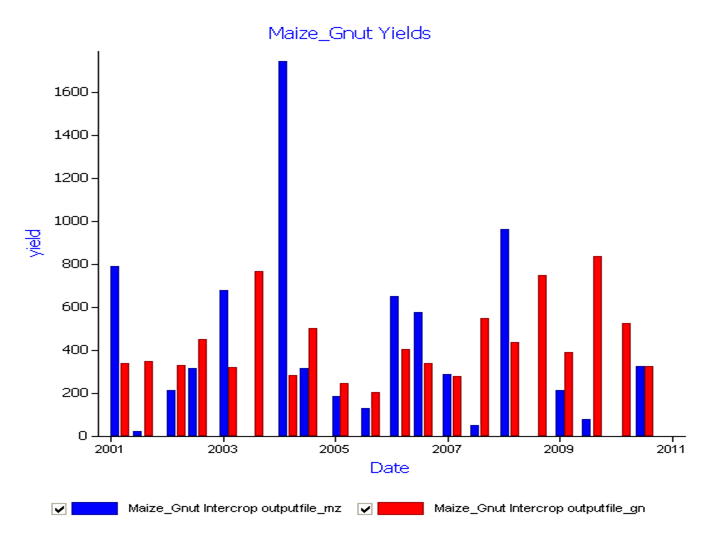
- Create a graph of Date vs. Yield. (‘Date’ is better then ‘Year’ on the x-axis, so as to separate out the Long an Short rains yields in a given year)
- Add a Title to the graph, identifying it as Maize-Gnut Yields. To find out how to add a title to a graph see: How To Modify a Graph component

With intercropping, most maize yields are below 1000kg/ha and there are 9 of 20 seasons where maize yields are less than 200kg/ha. Groundnut yields are 800kg/ha and less. How do these yields compare with the maize-gnut rotation?
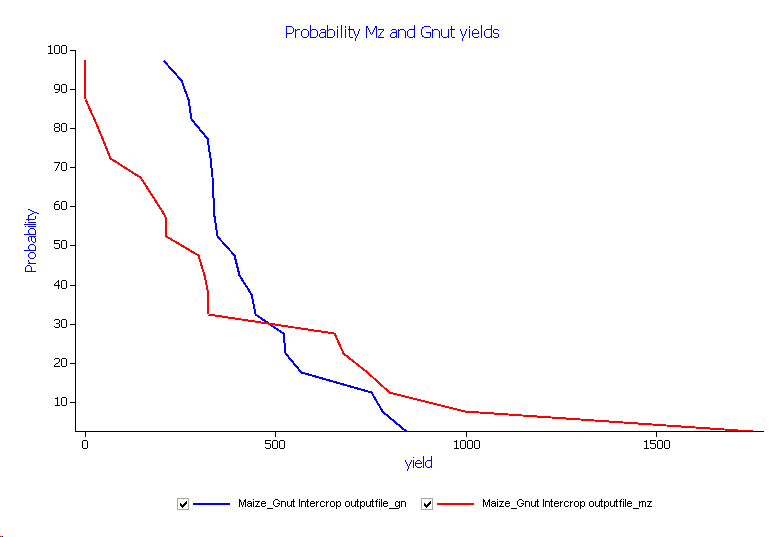
- Drag a Probability Exceedence graph onto the simulations node. (This will allow the Graph package to see both outputfile_mz and outputfile_gn data as well the output from the rotation experiment.)
- Create a graph of yield, maize.yield and peanut.yield variables .
- Add a Title to the graph, identifying it as Probability Mz and Gnut yields.

This data is not strictly comparable, but it clearly shows that intercropping maize with groundnut is a high risk strategy for the combination of Embu climate and the shallow soil used in these simulations.
What simulations would need to be done to help make the above data more complete for comparison purposes?
