
The effect of residue cover on soil water storage
Tracking the decline of cover as residues decompose
APSIM simulates the influence of crop residues on the efficiency with which water is captured and retained during fallows. But residue cover declines as residues decompose. Residue decomposition is simulated in APSIM in response to weather, as well as the chemical composition of the residues. By doing this simulation you will reinforce skills learned in previous exercises and learn to do some basic editing of default values to ‘customise’ your simulations.
This simulation will demonstrate how surface residue decomposes over time. You should use the previous simulation as a starting point for this simulation. You need to add an initial amount of surface residues.
- Reopen the previous file (Fallow water balance.apsim)
- Save the file as Residue.apsim (Reminder: don’t forget to use the Save as button, NOT the Save, or you will save these changes to Fallow water balance.apsim)
- Remove the Clay Fallow simulation. We’re going to use Sand Fallow as our starting point for this exercise. Also remove the graph components.
- Make a copy of the Sand Fallow simulation by dragging to the top node in tree (Simulations).
- Rename second simulation to Sand maize residue
- At the ‘surface organic matter’ node, set the starting surface organic matter mass to 2000 kg/ha and the Pool and Type of residues to maize.
- Run the simulation
- Create a graph of day vs surfaceom_cover and rain(right hand axis) for the Sand maize Residue simulation. Drag an XY graph from the “Graphs” folder in the Graph toolbox onto the output file, and rename it to maize_cover. Remember to set “Point type” to “None”. To find out how to modify a graph see How To Modify a Graph Component
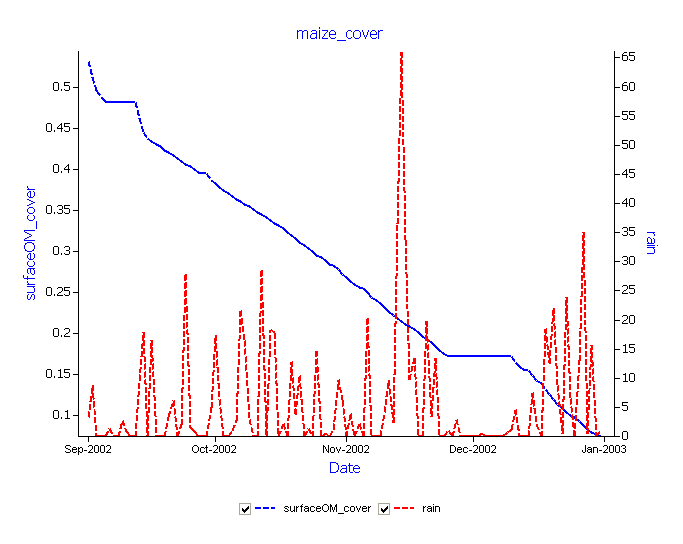
It can be seen that periods of high decomposition rate match with higher rainfall and low decomposition with dry periods.
The effect of cover decline on runoff and evaporation
In this activity, a comparison will be made of two simulations: ‘Sand Fallow’ and ‘Sand Maize Residue’.
- Copy the maize_cover graph that we’ve just created to the clipboard, and paste it onto the simulations node at the top of the tree.
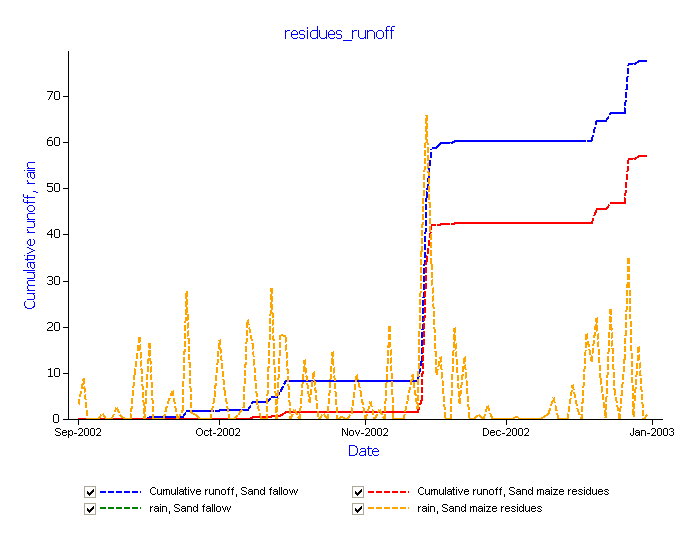
- Graph Date vs runoff(cumulative) and rain (this time on the same axis as the runoff, NOT right hand axis)
- Rename this graph residues_runoff. Notice that data from both simulations (Sand Fallow and Sand Maize) appears.
The effect of residue type on speed of decomposition
The APSIM residue model will decompose residues at differing rates according to the C:N ratio of the material. To demonstrate this we will reproduce the previous simulation but apply legume residues in the place of the maize residues.
- Create another copy of the Sand maize Residue simulation and call it Sand Cowpea Residue.
- Change the residue parameters to 2000 kg/ha of Cowpea (type) residue. Set the C:N ratio to 20. (Remember you may want to change the Organic Matter pool name to something like cowpea as well)
- Run this new simulation. (If you just select this simulation in the tree and click the run button it will only run this simulation instead of all of them)
- Graph the Sand maize and Sand cowpea residue simulations with residue cover as a function of time (eg date). Add rain to the right hand axis if you like.
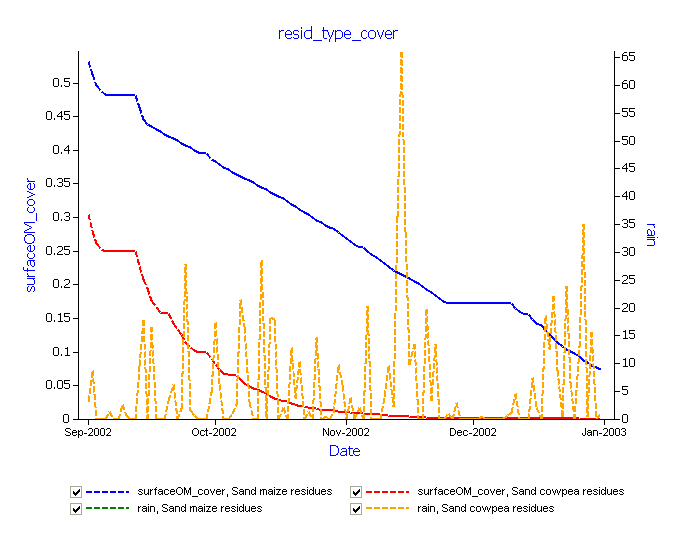
- Rename the graph to “resid_type_cover”.