Oil Palm
Developers:
Neil I. Huth, CSIRO Ecosystem Sciences/Sustainable Agriculture Flagship, Toowoomba, Australia
Murom Banabas, PNG Oil Palm Research Association, Dami, Papua New Guinea
Paul N. Nelson, Centre for Tropical Environmental and Sustainability Science, James Cook University, Cairns, Australia
Michael Webb, CSIRO Land and Water/Sustainable Agriculture Flagship, Townsville, Australia
Sensibility/Plausibility tests
Apsim\tests\validation\oilpalm\oilpalmvalidation.apsim
Data is not available for sensibility testing of a wider range of environments. However, outputs for N and C cycling, and water balance have been output in the existing validation simulations runs. The validation set covers the main agronomic ranges (ranges in N and environment) and so serves much of the purpose of a sensibility set. The only data on material balances of C, N and water were also taken on the same sites in various PhD and MSc studies and so they are ideal for the sensibility test. Furthermore, a plant population trial has be reproduced in the same APSIM input file that seeks to mirror the study of Bruere et al (1988). It is difficult to directly relate these outputs to the original study given the genetic advancement since this early date, but responses can be compared.
Validation tests
Apsim\tests\validation\oilpalm\oilpalmvalidation.apsim
Data from three sites across Papua New Guinea (PNG) with different climate and soils were used for model testing (Fig. 2). Soils range from sandy clay (volcanic ash) to alluvial clay. Mean annual rainfall ranges from 2400 mm (Sagarai and Sangara) to 4350 mm (Hargy) with annual rainfall variability larger at Sagarai than the other two sites. Whilst there is only a small difference in temperature across the sites, rainfall patterns do impact on both annual mean daily (Hargy 15.9 MJ; Sangara 17.0 MJ; Sagarai 18.1 MJ) and seasonal variation in solar radiation (Fig 2).
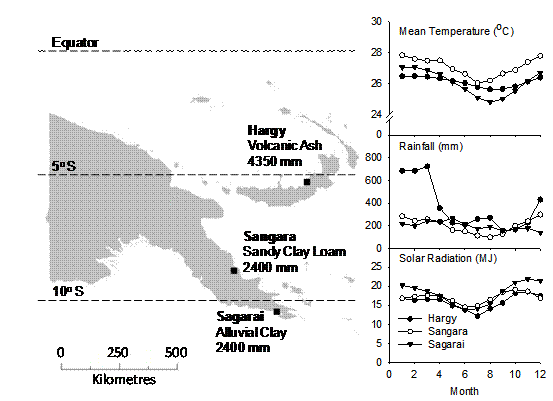
Figure 2. Locations of the three fertiliser trials used to testAPSIM-Oil Palm. Soil type, mean annual rainfall, monthly average daily temperature and solar radiation (http://power.larc.nasa.gov/) and monthly average rainfall are also shown.
Fertiliser trial data was obtained for each location from the PNG Oil Palm Research Association trial database (Table 1). All trials had commercial dura x pisifera palms planted in an equilateral triangular pattern. Trials included multiple rates of nitrogen including a control in which no nitrogen was applied. Fertilisers were applied in 2 to 3 applications per year. Trial 324 evaluated the effect of nitrogen rate and source (5 sources). There was no significant effect of nitrogen source and so these data have been combined in this study. Trial 504 investigated nutrient interactions (N x K). Data from treatments for which potassium was not limiting were combined. Trial 212 investigated nitrogen rate only. All other macro- and micronutrients were maintained at sufficient levels in all trials. Plots in each trial consisted of 16 to 30 palms surrounded by guard rows between neighbouring plots. Levels of replication ranged from 2 to 4. In trials 324 and 504 trenches were dug around plots to minimise poaching of nutrients by palms from neighbouring plots.
Table 1. Description of fertiliser trials and selected treatments used in model development and testing.
| Location | Trial Number† | Previous
Land Use |
Year
Planted |
Treatment Commenced | Population
(palms/ha) |
N Rates
(kg N/palm/y) |
| Hargy | 212 | Oil Palm | 1996 | 2002 | 140 | 0, 1.0, 2.0 |
| Sangara | 324 | Oil Palm | 1996 | 2001 | 135 | 0, 0.42,1.68 |
| Sagarai | 504 | Forest/Rubber Plantation | 1991 | 1995 | 127 | 0, 0.42, 1.26 |
† PNG Oil Palm Research Association trial identification number
Harvested ripe bunches were counted and weighed (together with loose fruits) fortnightly for every palm. Leaf samples were collected on frond 17 from selected palms in all plots at least once a year and were oven dried and analysed for nitrogen content. Petiole cross-sectional area, leaflet lengths and frond length of frond 17 was measured to allow calculation of leaf area and mass (Corley et al., 1971). The total number of fronds was counted, and the first frond was marked twice a year to determine frond production rate. Stem heights of the same selected palms were measured periodically in two of the trials and these were combined with a single measurement of stem diameter to calculate stem mass, assuming a linear increase in stem density with plantation age (Corley et al., 1971).
Parameterisation of soil process models used information from a variety of sources. Soil hydraulic properties were derived from pressure plate water retention data. Runoff curve number (Hawkins, 1996) was estimated to 72 for clay soils and 50 for ash soils using runoff data from PNG oil palm plantations (Banabas et al., 2008). Soil organic carbon data were available for Trials 324 and 504. Simulations of Trial 212 utilised carbon measurements available for a nearby planting. The fractionation of soil organic carbon into the various model pools is very important for model accuracy. It has been shown that it is possible to deduce, a priori, the apparent soil organic matter composition from observed patterns (Huth et al., 2010). The inert fraction of the total soil organic matter is an important parameter and methods for its determination for the volcanic soils in Papua New Guinea have not been developed. In this study we have made the simple assumption that the inert carbon content does not vary significantly with depth and that it can be approximated using the carbon content at a depth of approximately 0.5 m. Most carbon cycling occurs above this depth and carbon contents vary less below this depth. Therefore we assume that carbon above this value is available for decomposition. Finally, as trials 212 and 324 were planted into existing plantations, we initialise the surface organic matter pools to consist of 24 t/ha of fronds with a C:N of 39 and 63 t/ha of stems with a C:N of 145. In the absence of other information, the same initial surface organic matter was used for trial 504.
Daily meteorological data (rainfall, sunshine hours, temperature) for Trial 324 was taken from the nearby research station of the PNG Oil Palm Research Association. Sunshine hour data was used to calculate incoming global shortwave radiation using the approach used by Banabas (2007). Complete daily meteorological datasets were not available for the other two sites apart from some monthly totals for sunshine hours and rainfall. Daily estimates of the required climate data for these sites were derived from estimates obtained from the NASA Langley Research Center POWER Project funded through the NASA Earth Science Directorate Applied Science Program (http://power.larc.nasa.gov/). Adequacy of this dataset was tested via comparison of satellite-derived estimates of monthly mean solar radiation with that calculated from measured monthly sunshine hours for Hargy (data not shown). No data on sunshine hours were available for Sagarai and neither site had measured temperature data for comparison. Satellite-derived estimates of monthly rainfall were found to be inadequate when compared to available monthly rainfall data. Therefore, observed monthly rainfall totals were disaggregated into daily data using the satellite-derived daily rainfall estimates. Satellite-derived estimates of daily temperatures were used for these two sites, but could not be tested for their accuracy.
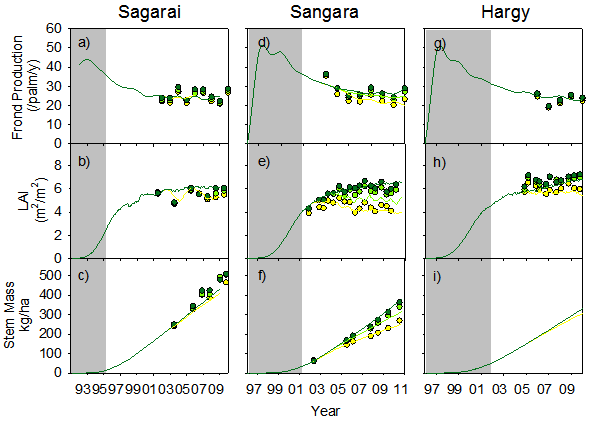
Time series of observed and predicted annual frond production (a,d,g), leaf area index (b,e,h) and stem mass (c,f,i) for the three sites used in testing APSIM-Oil Palm. Zero (yellow), low (light green) and high (dark green) nitrogen rate treatments are shown. Shaded areas indicate the period before treatments were imposed.
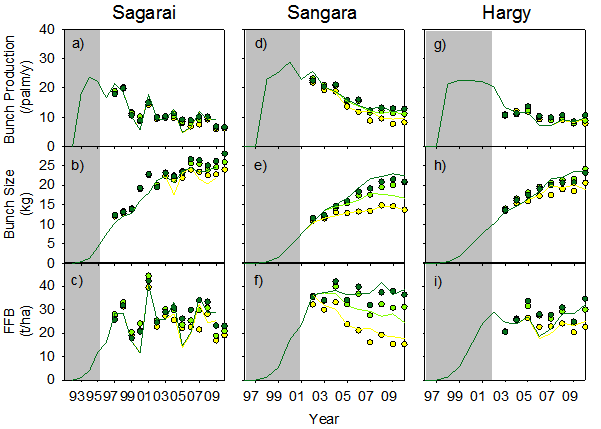
Time series of observed (symbols) and predicted (lines) annual bunch production (a,d,g), bunch size (b,e,h) and fresh fruit bunch yield (c,f,i) for the three sites used in testing APSIM-Oil Palm. Zero (yellow), low (light green) and high (dark green) nitrogen rate treatments are shown. Symbols and lines both indicate results for the preceding 12-month period. Shaded areas indicate the period before treatments were imposed.
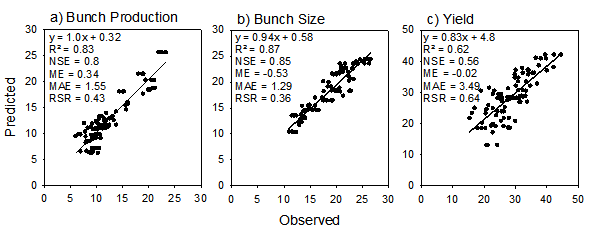
Plots of predicted vs observed yield and yield components for the three fertiliser trials used to test the model. Statistics (see text for description) for annual a) bunch production (/palm/y), b) mean bunch size (kg) and c) fresh fruit bunch yield (t/ha/y) include line of best fit, coefficient of determination (R2), Nash-Sutcliffe efficiency (NSE), mean error (ME), mean absolute error (MAE) and root mean square error to standard deviation ratio (RSR).
Description
APSIM-Oil Palm was developed using the Plant Modelling Framework (PMF) (Brown et al., these proceedings). The PMF provides the model developer with a library of objects describing commonly-used functions or algorithms for plant modelling. These are configured by the modeller into a model description using the eXtensible Markup Language (XML). APSIM-Oil Palm has been configured to simulate the growth of fronds, stem, roots and bunches in oil palm. The models for each of these are briefly described below. Fronds and fruit bunches are simulated in age-based cohorts created at the initiation of each successive frond and their subsequent development is traced via the rank of each cohort within the plant (Fig 1). Both the lowest (oldest) frond and lowest (oldest) bunch are removed at the harvest of a cohort.
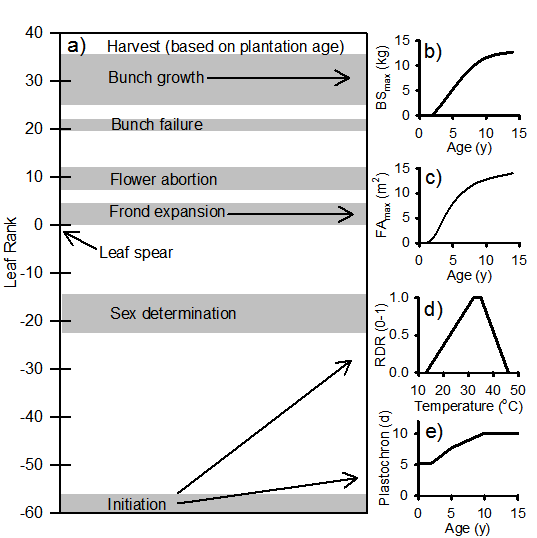
Figure 1. a) Timing of key phases for the growth of each cohort of fronds and fruit bunches, as well as graphical presentation of key functions for b) maximum bunch size (BSmax), c) maximum frond area (FAmax), d) relative developmental rate (RDR) and e) plastochron at optimum temperature.
Canopy
Frond initiation is calculated using an age-dependent plastochron (Fig 1e) which increases until age 10 years (von Uexküll et al., 2003). This value represents the shortest time interval between the initiation of successive fronds. The impact of temperature on plastochron is captured via a daily relative developmental rate (RDR) which is calculated in a manner similar to that of Combres et al. (2013). The four cardinal temperatures (Fig 1d) were fitted to frond appearance data from the three sites used in model testing. The model assumes plastochron and phyllochron are equivalent. After emerging as the ‘spear leaf’, the frond undergoes expansion for a further 5 phyllochrons. Each frond expands in a logistic fashion using the equations developed by Schultz (1992) for modelling leaf expansion in grapes. The maximum frond size increases to 14 m2 at age 14 years (Fig 1c).
Whilst seasonal variation in clear sky solar radiation is low in most regions located near the equator, variation from clouding in high rainfall environments is significant. Photosynthesis is calculated using a radiation use efficiency (RUE) of 1.22 g MJ-1 of intercepted direct beam total short wave radiation. RUE for diffuse light increases from this direct beam value by up to 33%, in proportion to the fraction of daily intercepted radiation, corresponding with the observed impact of diffuse light penetration on forest growth (Alton et al., 2007). Daily average RUE is calculated as the average of the direct and diffuse beam RUE values, weighted toward the diffuse light RUE using the square of the daily diffuse light fraction (Vankraalingen et al., 1989). Light interception is calculated using the Beer-Lambert law using extinction coefficients derived from data from a nearby site in West New Britain, Papua New Guinea (Breure, 1988) and other modelling (Vankraalingen et al., 1989), and is assumed to increase from 0.175 to 0.35 for direct beam, and 0.225 to 0.45 for diffuse beam, from 56 palms/ha to 186 palms/ha. The fraction of intercepted incoming radiation is also used to calculate potential evapotranspiration (Priestley and Taylor, 1972). Photosynthate is partitioned to various organs (fronds, stem, roots, bunches) based on individual demands. Partitioning during periods of supply limitation is according to relative sink strengths. Biomass demand for growing fronds is calculated from potential frond expansion rates using a specific leaf area (0.003 m2/g) that accounts for both leaf and rachis mass.
Frond nitrogen concentration (FNC), and its effect on photosynthesis and other growth processes, is specified using three cardinal concentrations. Uptake of nitrogen from the soil is sought to maintain the frond biomass at a maximum nitrogen concentration (FNCmax). Under nitrogen limitation, the actual frond nitrogen concentration may drop below these levels. Growth is constrained when FNC is below the critical nitrogen concentration (FNCcrit). Growth stops if FNC reaches the minimum nitrogen concentration (FNCmin). The relative nitrogen concentration (RNC=(FNC – FNCmin)/(FNCcrit-FNCmin)) is used as a nutritional growth factor for various plant processes including radiation use efficiency, leaf appearance rate, maximum bunch size and maximum frond size.
The oldest cohort of fronds are removed with each harvest of bunches. Information on frond mass (including carbon and nitrogen content) is communicated to the APSIM surface organic matter model, which subsequently calculates the decomposition and return of carbon and nitrogen to the soil over time. Frond biomass on the soil surface will affect modelled processes such as evaporation, runoff and erosion (Probert et al., 1998).
Stem
The proportion of daily assimilation partitioned to stem is calculated from daily frond growth using a stem to frond ratio which increases from 0 at planting to 0.25 by seven years of age. Studies of stem N content have demonstrated that N concentrations are high near the bases of growing fronds but decrease considerably to older parts of the stem. As a result, average whole stem N concentrations decrease with plant age. We use the equation of Goh (2005) who state that stem N concentration decreases from 1.37% to 0.351% by the age of 8.5 years.
Roots
The roots in the palm model are used to calculate access to soil resources of water and nitrogen, provide a sink for plant biomass and nitrogen, and to calculate the return of this plant root material to the soil organic matter pools. Root mass in each of the soil layers is simulated. Root depth is set to an initial depth (Dinit) at planting and progress downward through the profile over time at a fixed root front velocity (RFV) of 30 mm d-1 until the base of the lowest soil layer is reached or the plant reaches a site-specific maximum rooting depth (Dmax) (Carr, 2011). A fixed proportion of plant growth (10%) is partitioned to roots and this mass is distributed vertically into soil layers using the approach developed for simulating root proliferation by irrigated Eucalypts growing over water tables (Paydar et al., 2005). In this approach, further root mass is preferentially invested by the plant into soil layers where uptake of water and nitrogen per unit root mass is the highest. Root nitrogen concentration is set at 0.39% (Goh, 2005) and a constant root turnover rate of 0.001 d-1 is used for all soil layers.
Bunches
Cohorts of bunches are initiated with each new frond cohort and subsequently undergo phases of gender determination, flower abortion, bunch failure and bunch growth (Combres et al., 2013; Jones, 1997). As a result, the timing and duration of all phases can be expressed in terms of the rank of the related frond cohort within the plant (Fig. 1a) (Combres et al., 2013). Sex determination is calculated during a phase occurring 49 to 57 fronds before bunch maturity. Similarly, flower abortion is calculated during a phase 10 to 12 fronds after spear leaf. Finally, bunch failure is determined 21 fronds after spear leaf over the course of a single frond. Combres et al. (2013) showed that variation in the proportion of female flowers could be modelled in response to the ratio of assimilate supply to demand (RSD) within the whole plant. Therefore, the female flower fraction (FFF) for each cohort within the sex determination phase is decreased each day at a rate of 0.06 x (1 – RSD). In a similar manner, flower abortion and bunch failure fractions are calculated as 0.15 x (1 – RSD) during the abortion and bunch failure phases. Bunch growth rate is calculated from the ratio of the age dependent maximum bunch size (BSmax, Fig 1b) to the duration of the bunch growth phase.
Understory
Models for a wide range of grain and pasture legume species are available within APSIM (Robertson et al., 2002). However, models do not exist for species commonly used in the understory of oil palm systems. Furthermore, these species are often grown as mixtures with other legume or grass species and the temporal dynamics of competition between overstory and understory are complex. Therefore, we have developed a very simple model for the understory to provide a basic level of functionality for simulating soil cover, carbon and nitrogen inputs and water use by the understory within oil palm plantations. Data on understory canopy cover (Pipai, 2013) show that understory cover decreases after palm planting, with the reduction closely related to cover provided by the palm overstory. For simplicity, a fixed, user-specified, proportion of legumes and non-legumes is assumed through the life of the plantation. Light interception by the understory is calculated, after accounting for light interception by the overstory, and used to calculate an understory growth rate using an understory light use efficiency (εu) of 1.3 g/MJ which accounts for above- and below-ground growth. This biomass is returned to the soil surface as litter with a constant nitrogen concentration of 2.1% for legumes (Pipai, 2013) and 0.05% for non-legumes. A constant 44% of legume N comes from fixation (Pipai, 2013) with the remainder being taken up from the soil mineral N pools.
Other processes
The APSIM modelling framework provides the rest of the functionality required to simulate the oil palm system. The simulations presented here use the standard SoilWat, SoilN and SurfaceOM modules (Probert et al., 1998) for simulating water, N and surface organic matter processes. Management of the palms, including planting and fertiliser management, is specified using a management scripting language (Moore et al., these proceedings).
Model Interface
Parameters
| Parameter | Type | Optional? | Units | Description |
| UnderstoryCoverGreen | double | No | 0-1 | Green crop cover of the understory for the young plantation |
| UnderstoryLegumeFraction | double | No | 0-1 | Fraction of the initial understory that is legume |
Variables needed from other models
| Variable | Type | Optional? | Units | Description |
| BD | Double | No | oC | Bulk density |
| LL15_dep | Double | No | mm | 15 Bar lower limit |
| Dul_dep | Double | No | mm | Drained Upper Limit |
| Sat_dep | Double | No | mm | Saturation water content |
| dlayer | Double | No | mm | Thickness of each soil layer |
| Sw_dep | double | No | mm | Soil water content |
| No3 | Double | No | kg/ha | Soil nitrate content |
| latitude | Double | No | degrees | Latitude |
| day | Integer | No | – | Day of year |
| rain | Double | No | mm | Daily rainfall |
| radn | Double | No | MJ/m2/day | Daily incoming total shortwave radiation |
| eo | Double | No | mm | Daily potential evapotranspiration |
| today | datetime | No | – | Today’s date |
Variables supplied to other models (e.g. for reporting)
| Variable | Type | Units | Description |
| Plant_status | string | – | Plant status |
| Crop_type | string | – | Crop type |
| height | double | mm | Oilpalm canopy height |
| Cover_tot | double | 0-1 | Total canopy cover |
| Interception | double | mm | Rainfall intercepted by canopies |
| Root_depth | double | mm | Oil palm daily rooting depth |
| PotSWUptake | double | mm | Potential daily soil water uptake |
| SWUptake | double | mm | Daily soil water uptake |
| PEP | double | mm | Potential daily plant transpiration |
| EP | double | mm | Actual daily plant transpiration |
| DltDM | double | g/m2 | Daily total biomass growth (above+below) |
| FW | double | 0-1 | Daily water stress factor for photosynthesis |
| FWexpan | double | 0-1 | Daily water stress factor for expansion |
| Fn | double | 0-1 | Daily nitrogen stress factor for photosynthesis |
| CumulativeFrondNumber | double | – | Cumulative number of fronds grown |
| CumulativeBunchNumber | double | – | Cumulative number of bunches grown |
| CumulativeYield | double | g/m2 | Cumulative yield |
| ReproductiveGrowthFraction | double | 0-1 | Fraction of daily growth going into bunches |
| CarbonStress | double | 0-1 | Daily ratio of whole plant C supply:demand |
| HarvestBunches | double | – | Number of bunches harvested today |
| HarvestYield | Double | Kg/palm | Fresh mass of bunches harvested today |
| HarvestFFB | double | t/ha | Fresh mass of bunches harvested today |
| HarvestBunchSize | double | Kg | Average mass of bunches harvested today |
| Age | double | Years | Age of crop |
| UnderstoryCoverGreen | double | 0-1 | Green canopy cover of understory |
| UnderstoryPotSWUptake | double | Mm | Daily potential water uptake of the understory |
| UnderstorySWUptake | double | Mm | Daily water uptake of the understory |
| UnderstoryPotNUptake | double | Kg/ha | Daily potential N uptake of the understory |
| UnderstoryNUptake | double | Kg/ha | Daily N uptake of the understory |
| UnderstoryRootDepth | double | Mm | Daily root depth of the understory |
| UnderstoryPEP | double | Mm | Daily potential transpiration of the understory |
| UnderstoryEP | double | Mm | Daily actual transpiration of the understory |
| UnderstoryFW | Double | Mm | Daily water stress of the understory |
| UnderstoryDltDM | double | g/m2 | Daily biomass growth |
| UnderstoryNFixation | double | Kg/ha | Daily N fixation of the understory |
| StemMass | double | g/m2 | Stem mass |
| StemN | double | g/m2 | Stem nitrogen content |
| StemNConc | double | g/g | Stem nitrogen concentration |
| LAI | double | M2/m2 | Oil palm leaf area index |
| FrondArea | double | M2 | Average area of individual fronds on a palm |
| Frond17Area | double | M2 | Area of frond 17 |
| FrondMass | double | g/m2 | Frond mass |
| FrondN | double | g/m2 | Frond nitrogen content |
| FrondNConc | Double | g/g | Frond nitrogen concentration |
| BunchMass | Double | g/m2 | Bunch mass |
| BunchN | double | g/m2 | Bunch nitrogen content |
| BunchNConc | double | g/g | Bunch nitrogen concentration |
| RootMass | double | g/m2 | Root mass |
| RootN | double | g/m2 | Root nitrogen content |
| RootNConc | double | g/g | Root nitrogen concentration |
| PlantN | double | g/m2 | Total plant nitrogen content |
| TotalFrondNumber | double | – | Number of fronds on the palm |
| FrondNumber | double | – | Number of expanded fronds |
| Cover_green | double | – | Oil palm green canopy cover |
| SLA | double | cm2/g | Frond specific leaf area |
| FFF | double | 0-1 | Female flower fraction of the oldest bunch cohort |
| Defoliationfraction | double | 0-1 | Fraction of frond area removed today |
| DiffuseLightFraction | double | 0-1 | Diffuse light fraction of incoming total short wave radiation |
Events the model responds to (e.g. sow)
| Event | DataType | Optional? | Description |
| sow | SowType | No | Sowing |
Events the model sends to other models
| Event | DataType | Description |
| BiomassRemoved | BiomassRemovedType | Biomass removed |
| IncorpFOM | IncorpFOMType | FOM incorporated into soil |
| Harvesting | NullType | Notify that harvesting has taken place |
| Sowing | NullType | Notify that sowing has taken place |
| NewCrop | NewCropType | Notify that a new crop exists |
Tests
| Type of test | Folder location |
| Validation | %APSIM%\Tests\Validation\oilpalm |
| Sensibility | %APSIM%\Tests\Sensibility\oilpalm |
References
Alton, P.B., North, P.R., Los, S.O., 2007. The impact of diffuse sunlight on canopy light-use efficiency, gross photosynthetic product and net ecosystem exchange in three forest biomes. Global Change Biology 13(4) 776-787.
Breure, C.J., 1988. The effect of different planting densities on yield trends in oil palm. Experimental Agriculture 24(1) 37-52.
Brown, H.E., Huth, N.I., Holzworth, D.P., Teixeira, E.I., Zyskowski, R.F., Hargreaves, J.N.G., Moot, D.J., these proceedings. Plant Modelling Framework: Software for building and running crop models on the APSIM platform. Environmental Modelling & Software.
Carr, M.K.V., 2011. The water relations and irrigation requirements of oil palm (Elaeis guineensis): A review. Experimental Agriculture 47(4) 629-652.
Combres, J.-C., Pallas, B., Rouan, L., Mialet-Serra, I., Caliman, J.-P., Braconnier, S., Soulie, J.-C., Dingkuhn, M., 2013. Simulation of inflorescence dynamics in oil palm and estimation of environment-sensitive phenological phases: a model based analysis. Functional Plant Biology 40(3) 263-279.
Goh, K.J., 2005. Fertilizer recommendation systems for oil palm: estimating the fertilizer rates.
Jones, L.H., 1997. The effects of leaf pruning and other stresses on sex determination in the oil palm and their representation by a computer model. Journal of Theoretical Biology 187 241-260.
Moore, A., Holzworth, D., Herrmann, N., Brown, H., deVoil, P., Snow, V., Zurcher, E., Huth, N., these proceedings. Modelling the manager: representing rule-based management in farming systems simulation models. Environmental Modelling & Software.
Paydar, Z., Huth, N., Snow, V., 2005. Modelling irrigated Eucalyptus for salinity control on shallow watertables. Australian Journal of Soil Research 43(5) 587-597.
Pipai, R., 2013. Biological Nitrogen Fixation By Cover Legumes Under Oil Palm Plantations In Papua New Guinea, School of Agriculture, Food and Wine. Faculty of Sciences. The University of Adelaide: Australia.
Priestley, C.H.B., Taylor, R.J., 1972. On the assessment of surface heat flux and evaporation using large scale parameters. Monthly Weather Review 100 81-92.
Probert, M.E., Dimes, J.P., Keating, B.A., Dalal, R.C., Strong, W.M., 1998. APSIM’s water and nitrogen modules and simulation of the dynamics of water and nitrogen in fallow systems. Agricultural Systems 56 1-18.
Robertson, M.J., Carberry, P.S., Huth, N.I., Turpin, J.E., Probert, M.E., Poulton, P.L., Bell, M., Wright, G.C., Yeates, S.J., Brinsmead, R.B., 2002. Simulation of growth and development of diverse legume species in APSIM. Australian Journal of Agricultural Research 53 429-446.
Schultz, H.R., 1992. An empirical model for the simulation of leaf appearance and leaf area development of promary shoots of several grapevine (Vitis-vinifera L) canopy systems. Scientia Horticulturae 52(3) 179-200.
Vankraalingen, D.W.G., Breure, C.J., Spitters, C.J.T., 1989. Simulation of oil palm growth and yield. Agricultural and Forest Meteorology 46(3) 227-244.
von Uexküll, H., Henson, I.E., Fairhurst, T., 2003. Canopy management to optimize yield, In: Fairhurst, T., Härdter, R. (Eds.), The Oil Palm – Management for Large and Sustainable Yields. Potash & Phosphate Institute of Canada, Potash & Phosphate Institute, International Potash Institute: Singapore, pp. 163-180.
