
AgPasture
AgPasture is a pasture growth model developed and integrated in APSIM. It is largely based on the physiological model of Thornley & Johnston (2000) as implemented in SGS/DairyMod/EcoMod (Johnson et al. 2008), but some changes have been incorporated in describing plant growth in relation with environmental factors, and in model structures for plug-in the APSIM system. Also, a set of management tools has been developed for modelling pasture management such as grazing, cutting and renewal.
AgPasture is primarily designed for the simulation of mixed pastures of C3 and C4 grasses and legumes. The default module has been parameterised for any combination of perennial ryegrass, white clover and paspalum.
Setting up a simulation
The easiest way to set up a pasture simulation is to open the example simulation (agpasture.apsim), and save it as new simulation and modify it according to the pasture to be simulated.
Same as with other crop models in APSIM, simulation of a pasture paddock needs to include a minimum set of other modules in APSIM system in addition to AgPasture. These include Micromet, Soil (SoilN and SoilWat or SWIM), Surface Organic Matter (SurfaceOM) and Fertiliser, and optionally Irrigation and pasture Managers (e.g., “Regular harvest or grazing with return” in Fig 1). AgPasture relies on Micromet to calculate solar radiation interception and water demand of pasture plants, and uses Fertiliser to return animal urine to soil profile.
Pasture Parameters
The AgPasture component is listed under the ‘Crop’ folder in the ‘Standard’ tool box. The default AgPasture is an established pasture of perennial ryegrass and white clover, with initial pasture status (See AgPasture GUI in Fig 2). The parameters include pasture species, and their initial shoot mass and litter mass (kg DM/ha). The parameter values are specified by species in different columns and can be adjusted by users. Also, plant root depth and the assumed distribution profile of relative root mass in soil profiles (with maximum = 1) can be specified. The root distribution profile should have the same number of layers as that described in the soil module, but a minimum number of layers will be used in calculation when they are not the same. The last parameter specifies if the plant water uptake is calculated by the AgPasture module itself (default as ‘calc’) or by another module in APSIM.
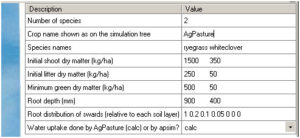
Fig 2 Graphical User Interface for setting up the initial state of AgPasture
After dragging an AgPasture component into a paddock, users may specify the initial state. Users may also cultivate the soil and sow pasture using the ‘Sow pasture’ Manager described below.
Pasture managers
The Manager module of APSIM provides a flexible approach to allow the user to set up pasture management practices or rules. A set of Managers have been setup to go with the AgPasture module with GUI for convenience, which is in the Standard toolbox, under ‘Management\AgPasture management’ folder. These include:
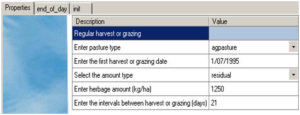
Fig 3 Specification of pasture management – Regular cut and remove (with no return)
Regular cut and remove (with no return) (Fig 3)
It shows that the pasture is not harvested before 1/07/1995, the harvest frequency is once every 21 days and the harvest residual is 1250 kg/ha. In this case, the harvested herbage is assumed as removed from the pasture.
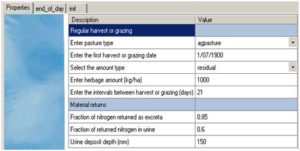
Fig 4 Specification of pasture management – regular harvest or grazing (with return)
Regular harvest or grazing (with return) (Fig 4)
It shows that the pasture is not harvested before 1/07/1995, the harvest frequency is once every 21 days and the harvest residual is 1000 kg DM/ha. 85% of grazed/harvested nitrogen is returned to soil, of which 60% is in urine and returned to the soil profile to a depth of 150 mm. The return of animal ingested nitrogen depends on animal type, age and health conditions, as well as management. Default nitrogen removal is 15% for sheep & beef, and 25% for dairy grazed pastures but it remains the user’s choice to set a sensible value for their system.
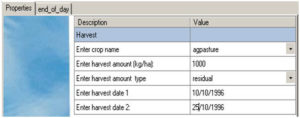
Fig 5 Specification of pasture management – cut and remove on fixed dates (with no return)
Cut and remove on fixed dates (no return) (Fig 5)
It shows the two harvests at specified dates, with a residual of 1000 kg DM/ha left after each harvest. The user may right-click on the panel to change it into ‘ Mode’, and add more dates on the ‘Properties’ tab, and open the ‘end_of_day’ to copy and paste the script for the added dates, for setting up the harvests on multiple dates.
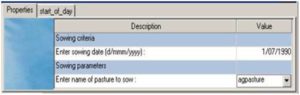
Fig 6 Specification of pasture management – rotational grazing with herbage mass between two limits
Rotational grazing with herbage mass between two limits (Fig 6)
It specifies:
· to start grazing when herbage mass reaches 1800 kg DM/ha;
· the daily herbage harvest (grazed) is 400 kg DM/ha;
· to stop grazing when the herbage mass is reduced to a residual of 1000 kg DM/ha;
· 85% of grazed/harvested nitrogen returns to soil, of which 60% is in urine and returned to soil profile to a depth of 300 mm.
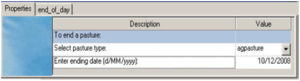
Fig 7 Specification for sowing a pasture
Sow pasture on a fixed date (Fig 7)
The default initial state of AgPasture is established perennial pasture as described above. If an user wants to establish a pasture from sowing, the manager described above (Fig 7) could be used.
Fig 8 Specification for ending a pasture
End pasture on a fixed date (Fig 8)
This manager simply terminates he pasture, making the paddock available for other uses.
Model output variables
AgPasture model output variables are described in table 1. Note that some variables are arrays, which are either an array of plant properties for different species, or an array of soil properties for different soil layers.
Table 1: Output variables of AgPasture module
Variables names Descriptions
AboveGroundDeadN Nitrogen in plant standing dead (kg N/ha)
AboveGroundDeadWt Plant aboveground dead mass (kg DM/ha)
AboveGroundLiveN Nitrogen in plant live shoots (kg N/ha)
AboveGroundLiveWt Plant aboveground live mass (kg DM/ha)
AboveGroundN Nitrogen in plant aboveground mass (shoots) (kg N/ha)
AboveGroundNConcentration Plant shoot N concentration (%)
AboveGroundWt Plant aboveground mass (kg DM/ha)
BelowGroundN Nitrogen in plant roots (kg N/ha)
BelowGroundWt Plant below ground mass (kg DM/ha)
Biomass ( = AboveGroundWt) (kg DM/ha)
Cover_dead Cover of dead leaf area (%)
Cover_green Cover of green leaf area (%)
Cover_tot Cover of total leaf area (%)
Crop_Type Crop type
DefoliatedDigestibilty Digestibility of defoliated plant material (0-1)
GLFn Plant growth limiting factor due to nitrogen stress (0-1)
GLFnConcentration Plant growth reduction factor due to low N concentration (0-1)
GLFrgr Plant growth limiting factor due to other factors (0-1)
GLFtemp Plant growth limiting factor due to temperature (0-1)
GLFwater Plant growth limiting factor due to water deficit (0-1)
HarvestN Daily plant nitrogen harvest (kg N/ha)
HarvestWt Daily herbage harvest (kg DM/ha)
Height Pasture height (mm)
HerbageDigestibility Digestibility of standing herbage (0-1)
HerbageME Metabolic energy of standing herbage (MJ/ha)
IntRadn Intercepted solar radiation (MJ)
LAI_dead Dead leaf area index (m2/m2)
LAI_green Green leaf area index (m2/m2)
LAI_total Total leaf area index (m2/m2)
LeafDeadWt Plant dead leaf mass (kg DM/ha)
LeafLiveWt Plant green leaf mass (kg DM/ha)
LeafN Nitrogen in plant leaves (kg N/ha)
LeafWt Plant aboveground leaf mass (kg DM/ha)
LitterDepositionN Daily plant shoot nitrogen deposition in litter (kg N/ha)
LitterDepositionWt Daily litter deposition (kg DM/ha)
NetHerbageGrowthWt Daily net herbage accumulation (kg DM/ha)
NitrogenDemand Plant nitrogen demand (kg N/ha)
NitrogenSupply Plant available nitrogen in soil (kg N/ha)
NitrogenSupplyLayers Plant available nitrogen in soil layers (array, kg N/ha)
NitrogenUptake Plant nitrogen uptake (kg N/ha)
NitrogenUptakeLayers Plant nitrogen uptake from soil layers (array, kg N/ha)
PlantFixedN Daily plant nitrogen fixation (kg N/ha)
PlantRemobilisedN Plant N remobilisation (kg N/ha)
PlantStatus Plant status – ‘live’ or ‘dead’
PotentialGrowthWt Daily plant potential growth (kg DM/ha)
RootSenescenceN Daily plant root nitrogen deposition in senescent roots (kg N/ha)
RootSenescenceWt Daily root senescence (kg DM/ha)
SpeciesGreenLAI Species – total leaf area index (array, m2/m2)
SpeciesHarvestPct Species – percentage in harvested plant material (array, %)
SpeciesLiveWt Species – total aboveground live mass (array, kg DM/ha)
SpeciesTotalWt Species – total aboveground mass (array, kg DM/ha)
StemDeadWt Plant dead stem mass (kg DM/ha)
StemLiveWt Plant live stem mass (kg DM/ha)
StemN Nitrogen in plant stems (kg N/ha)
StemWt Plant aboveground stem mass (kg DM/ha)
StolonN Nitrogen in plant stolons (kg N/ha)
StolonWt Plant stolon mass (kg DM/ha)
TotalPlantN Plant total nitrogen (kg N/ha)
TotalPlantWt Plant total mass (kg DM/ha)
WaterDemand Plant water demand (mm)
WaterSupply Plant extractable soil water (mm)
WaterSupplyLayers Plant extractable water in soil layers (array, mm)
WaterUptake Plant water uptake (mm)
WaterUptakeLayers Plant water uptake from soil layers (array, mm)
Model structure and scientific base
AgPasture is largely based on the physiological model of Thornley and Johnson (2000) as implemented in SGS/DairyMod/EcoMod (Johnson et al. 2008). Most of the processes and functions in plant growth have been described in these publications and in documents of Johnson (2008). Here we briefly describe the module structure and the daily pasture growth process in relation with other modules in the APSIM system. Emphasis is on the structures, processes and functions that are different from the previous model descriptions.
AgPasture is majorly a temperate pasture model of ryegrass-clover type, but C4 species can be added. Plant growth processes include photosynthesis and respiration followed by tissue turnover and senescence. Effects of water and nitrogen stress are incorporated. All the plant functions and processes, such as carbon assimilation, tissue turnover, water and nitrogen uptake, are modeled at a species level. The species compete for resources (e.g., solar radiation, soil moisture and nitrogen) and simulated species properties are aggregated into that of the pasture module (Fig 9)
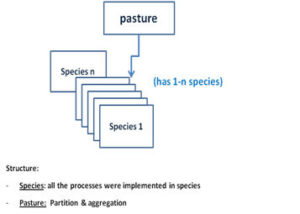
Fig.9 Pasture module of multiple species
Fig 9 Pasture module consisting of one to many species. Plant processes are implemented at species level, while pasture (community) is responsible for resources partitioning among species and aggregating of species properties into that of pasture swards.
APSIM is a daily time-step simulation system. The program flow of AgPasture in APSIM during a one day time-step are as follows. The underlined words or terms are other APSIM modules related or used in the process. Those modules are documented separately.
(1) Update weather data (Met):
(2) Calculate site-specific pasture potential growth (Gpot) : This includes gross photosysnthesis, growth and maintenance respiration and their relations with environmental conditions (solar radiation and temperature).
(3) Calculate soil moisture deficit: Daily pasture water demand (potential transpiration) is calculated using Penman-Menteith equations (Micromet). Plant uptakable water in soil profile (SW) may be calculated using the soil water capacity module (SoilWat) or alternatively the soil water infiltration and movement module (SWIM). The SW is partitioned to different species relative to their demands. Actual plant water uptake equals to water demand if the demand is bigger than supply (PT< SW); otherwise plant water uptake equals the water supply (SW), and in this case, the soil moisture limiting factor (GLFw) is defined using the ratio of plant water uptake to demand. Soil moisture uptake from the soil profile is removed.
(4) Pasture N demand and soil N supply: Plant N demand is calculated according to maximum and optimum N concentration of potential new growth tissues, plant N status and N remobilisation. Soil N supply is the mineral N in the root zone of soil profile (SoilN). Nitrogen limitation occurs when plant available N is less than demand, and a N limiting factor (GLFn) for pasture growth is defined as the ratio of plant available N to plant N demand. However, before partitioning plant available N among species, the N-fixation of legume species is calculated. The fraction of actual N fixation of legume species against its total N demand under N stress (GLFn) is calculated as:
F = Fmax + (1 – Fmin) × GLFn
where Fmax and Fmin are the fractions of N-fixation in total N-demand when soil N is unavailable and sufficient. Plant available N in soil layers is partitioned among species relative to their demands, and GLFn of each species are updated separately as the ratio of actual plant N uptake to demand.
GFLn = N uptake/ N demand.
Plant N uptake is removed from soil profile.
(5) Effects of water and N limitation on pasture growth: Nitrogen limitation affects plant growth by both reducing new plant tissue growth (reducing green leaf area expansion ) and diluting N concentration in existing plant tissues, which in turn reduce plant radiation efficiency (Lemaire and Salette 1984). The effect is calculated by constructing a N concentration factor (FNc) as follows:
FNc = (N – Nmin)/(Nopt – Nmin) if N<nopt< i=”” style=”padding: 0px; margin: 0px;”>
FNc = 1 if N≥Nopt
where N, Nopt and Nmin are actual, optimum and minimum N concentration of plant leaf tissue. So plant new growth incorporating N concentration and water-deficit effects, but not N shortage for the daily uptake, is calculated as:
Gw = Gpot × minimum (GLFw , FNc)
Then the effects of soil mineral N shortage against plant daily demand is added by multiplying the square root of GLFn.
G = Gw × sqrt (GLFn)
The square root is used to partition the effects of N limitation on plant growth (i.e. the effect on plant tissue increase including green leaf area expansion and the dilution of N concentration in plant tissue). The N concentration in different plant tissue pools are updated daily.
(6) Partitioning of plant new growth Plant new growth is partitioned to plant shoots and roots using a dynamic partitioning coefficient towards a target root/shoot ratio as described in Johnson (2008). A variable target root/shoot ratio is used for partitioning more assimilates to shoots in spring (roughly corresponding to reproductive stages) and less in autumn, as experimentally evidenced by (Parsons and Robson 1981). The assimilates partitioned to shoots are partitioned again among stem (+sheat), stolon and leaf.
(7) Plant tissue turnover Plant shoot tissue is traced as four pools (growing, mature, scenesing, and dead). Plant new growth are transferred among these pools and finally scenesced and transferred to litter, surface organic matter pool (SurfaceOM). Senecent root returns to soil fresh organic matter pool (FOM).
Acknowledgement
This work was funded under the Foundation for Research Science and Technology of New Zealand as a part of “Rural Futures” programme (C10X0809) with assistance from the WFSAT.
References
Li FY, Snow VO, Holzworth DR (2011) Modelling the seasonal and geographical pattern of pasture production in New Zealand. New Zealand Journal of Agricultural Research 54: 331-352.
Li FY, Snow VO, Holzworth D, Johnson IR (2010) Integration of a pasture model into APSIM, Proceedings of the 13th Australian Agronomy Conference, Lincoln, New Zealand (doi: http://www. regional.org.au/au/asa/2010/farming-systems/simulation-decision-support/6993_lifyrevis.htm).
Li, FY, Snow VO (2010) Nitrogen processes and nitrogen use efficiency in pastoral systems under differing management – a modelling analysis. In: Currie L.D. and C.L. Lindsay (Eds), Farming’s Future: Minimising Footprints and Maximising Margins – The 23rd FLRC conference proceedings. Massey University, New Zealand. pp. 219-226.
Johnson IR (2008) Biophysical pasture simulation model documentation – Model documentation for the SGS Pasture Model, DaityMod and EcoMod (WAFSAT project report).
Johnson IR, Chapman DF, Snow VO, Eckard RJ, Parsons AJ, Lambert MG, Cullen BR (2008) DairyMod and EcoMod: biophysical pasture simulation models for Australia and New Zealand. Australian Journal of Experimental Agriculture 48, 621-631.
Lemaire G, Salette J (1984) Relation entre dynamique de croissance et dynamique de prelevement d’azote pour un peuplement de graminees fourageres I. Edude de l‘effet du milieu. Agronomie 4, 423-430.
Parsons AJ, Robson MJ (1981) Seasonal changes in the physiology of S24 perennial ryegrass (Lolium perenne L.) 3 Partition of assimilates between root and shoot during the transition from vegetative to reprodcutive growth. Annals of Botany 48, 733-744.
Thornley JHM, Johnson IR (2000) Plant and crop modelling – a mathematical approach to plant and crop physiology.'(The Blackburn Press: New Jersey).