
Cotton
Enhancements to the Root Development routines and water extraction routine in APSIM-Cotton
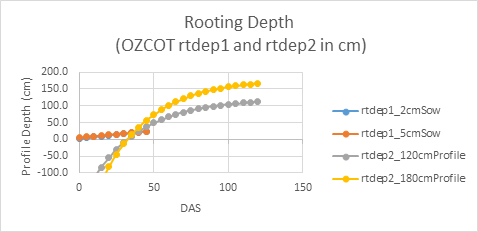
APSIM-Cotton is extensively based on the OZCOT (Hearn, 1994) cotton model. OZCOT was designed with a very empirical approach to root development. The equations used were developed for the heavy clay soils at Myall Vale, NSW Australia and the only variables that are used to estimate rooting depth are the depth of the soil profile and the Days After Sowing (DAS). Plant growth, environmental conditions and soil hospitality for root growth play no part in the root development. This was a legacy of the OZCOT model and was not consistent with the approach used for other models in APSIM.
In order to implement the standardised APSIM approaches for soil water uptake and root development which utilise the ‘kl’ extraction factors and ‘xf’ soil constraint factors for each soil layer, the cotton model required modifications.
The logic used in APSIM’s ‘Plant’ was used as the base of the routine in cotton ‘ozcot_swbal_removeEp()’ (Appendix 1).
‘kl’ values for cotton estimated by the APSIM-Soil module
| Crop | 0-15 | 15-30 | 30-60 | 60-90 | 90-120 | 120-150 | 150-180 |
| Cotton | 0.10 | 0.10 | 0.10 | 0.10 | 0.09 | 0.07 | 0.05 |
Published ‘kl’ values specifically for cotton are scarce, if not non-existent.
Root Growth:
OZCOT’s root growth has two phases, from sowing to about 39 DAS and then from this point on until harvest. The first phase equates to a growth rate of 6 mm / day. The second phase has a peak growth rate of about 30 mm /day.
The routines from APSIM ‘Plant’, and specifically using wheat as an example, were used as a base to develop new cotton root development routines. Wheat uses root depth growth rates which vary based on crop stages. Cotton, having very different crop stages and being an indeterminate crop, requires a different approach to altering the rate of root growth. Rather than altering the rate based on crop stage, an approach has been developed which is similar to the BollLoad / CarryingCapacity(C) calculation that controls the fruiting cutout (Hearn, 1994, eqn 5) response. Cutout is the size or the fruit load that causes fruiting site production to stop. This is observed as a pause in the overall growth of the cotton plant while resources are directed into maturing the fruit on the plant. Apart from this fruit load feedback response, most other root growth parameters, as seen in wheat, have been maintained. The end result is a routine that can fairly closely mimic the original OZCOT root growth curve for a typically well irrigated crop on a 1500 – 1800 mm profile clay soil, but can also respond to drier soils, saturated layers or other soil conditions that are not hospitable to root growth. Crop growth now also has a direct effect on root growth, something that was not part of the original OZCOT root growth function.
Germination to Emergence
From the sowing depth the roots descend at a default rate of 6 mm/day. If emergence is delayed by adverse conditions – dry soil, high or low temperatures – then the root development is correspondingly delayed. At emergence the root depth is approximately 100 mm. Errors at this point will be small and have minimal impact. The Extraction Front for soil water use cannot be established at this early stage.
Post-Emergence
Goyne (2000) found that there was a delay after emergence until the commencement of descent of the Extraction Front (t0) and that this delay was correlated with the clay content of the surface layer. A delay in the commencement of the descent of the Extraction Front was also reported by Meinke (1993) when studying sunflowers. This delay is consistent with the phase 1 of root development in the original OZCOT model which had slow root growth for 39 days after sowing. With no crop stage transition defined for any development in cotton around this point, the t0 period – the delay until the commencement of the descent of the Extraction Front – has been linked to the early development of leaf area. Once a critical value for leaf area per plant has been reached then the rate of root depth increase is allowed to reach maximum Root Front Velocity. The critical leaf area per plant is defined by the user input parameter ‘rootLACrit’, which has a default value of 0.012 m2/plant (which is about 20 times the leaf area of the cotyledons). Varying this value allows the duration of t0 to be varied. The value chosen as the default allows the validation data sets to mimic the delay of 39 days set in the original OZCOT. As root development should correlate fairly closely to the development of leaf structure, it is anticipated that this default value will prove to be reasonably robust.
The maximum rate of root depth growth, or Root Front Velocity (RFV) is reported in various journal papers as anything from 20 mm/day right up to 65 mm/day for some growth phases and given conditions (Bland, 1992). In general, the consensus is that between 20 and 30 mm/day is most appropriate for simulation modelling. This is also in agreement with the original OZCOT model that has a peak growth rate of 30 mm/day, but then exponentially decays to zero when the crop is mature. In these enhancements the maximum root growth rate is defined by the user parameter ‘RFV_max’ and it has a default value of 30 mm/day.
Root Depth Increase
(Code included as Appendix 2: Ozcot_root_depth() )
Following the pattern used by root depth in Plant, Cotton establishes a number of factors that can be used to determine the hospitality of the soil layers for root growth at the roots growing front. These factors are calculated from sets of (x,y) value pairs that define response relationships and are user definable. The factors (0 – 1 scale) calculated are for:
1) fraction of available soil water (fasw) for soil water content between crop lower limit and drained upper limit;
x_sw_ratio = { 0.0, 0.25, 0.5, 1.0}
y_swfac_root = { 0.0, 0.2, 1.0, 1.0}
2) availability of pore space for when soil water content is above DUL;
x_sat_ratio = { 1.0, 1.2 };
y_satfac_root = { 1.0, 0.0 };
3) demand / supply ratio for the plants demand as a portion of available soil water.
x_sw_ds_ratio = { 0.0, 0.3, 1.0 };
y_sw_ds_fac_root = { 0.3, 1.0, 1.0 };
The minimum (ie. most limiting) of these factors is used as the calculation of potential root growth. It is only in the more extreme conditions that these factors have an effect; that is, when the soil is saturated, very dry, or potentially when the demand is only a small fraction of the available water (ie. water demand is not driving the growth of roots).
Plant can utilise a temperature factor in addition to the factors described above. Cotton has not implemented a temperature factor as the environmental temperature will have a much more direct effect on plant growth and therefore assimilate supply than what it will on root growth directly. The lack of any supportive data for calibrating such a factor has led to it being omitted.
The main driving relationship is calculated as a root assimilate supply factor. It is calculated by the equation:
rootAssimFactor = -0.12 * Math.Log(rootBLR) + 0.03;
where rootBLR = (bload / cutout);
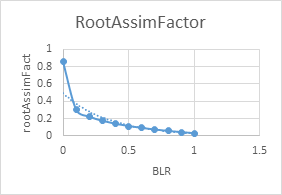
Here, bload is the cotton fruit load as measured in assimilate demand and cutout is a function of fruit carrying capacity / bload. These values are calculated and utilised in the fruiting routines of the cotton model. The implemented relationship allows optimal root growth during peak vegetative growth, and slows root growth as fruit load increases. If roots have not reached the maximum rooting depth by the time the root growth is restricted to a near zero rate, then root growth will recommence after the boll load lessens due to fruit maturing. Vegetative growth follows this same pattern and caters for the indeterminate nature of the cotton crop.
Rooting depth is limited to the lesser of rtdep_max (user specified max root depth) and the max depth of the defined soil profile.
Root advancement may be limited in or at any layer by an ‘xf’ value of less than 1.0 specified for a layer in the soil component. This follows the standard implementation of the ‘xf’ factor approach used throughout APSIM.
Summary
With these modifications a crop modeller is now able to speed up or slow down the rate of root growth, to advance or delay the onset of the descent of the extraction front and to retard or stop the progress of roots through a soil layer. Water uptake from each layer of soil can be modified by use of the ‘kl’ factors. This functionality brings cotton more in line with the functionality of ‘standard’ APSIM crop models.
Other modifications included with enhancements
Soil Moisture Index (smi) (Hearn, 1994, p259) – The calculation of the smi value has included from early days a calculation of the smi in the top 30 cm of soil as well as the smi of the full rooted depth of soil. The greater of these two values is used as the smi for the model for that day. This appears to have been introduced to limit the effects of low smi values when, for example, sufficient rain had fallen to wet the surface layers and a crop is not under undue water stress.
Following this logic, it is sensible to also apply this approach for saturated soils. In this case, water logged soils will drain and leave surface layers less saturated sooner than if considering the whole rooted portion of the profile. This modification alleviates the observed problems that waterlogging effects, while required, are often too severe. With this modification applied, the often used ‘trick’ of adjusting the watlog_c value up from the default 0.87 to around 0.9 seems to become obsolete as the smi value rarely remains above the default 0.87 for many days. If continuous periods of rain are encountered, then waterlogging will still take effect. The default value of 0.87 corresponds to DUL and represents the 13% air porosity of the clay soil at DUL that the model was originally developed for.
flai – a cultivar parameter for adjusting the leaf area per site: It was discovered during reviews of the simulations that this value for most modern varieties (past 10 years or so) had been specified incorrectly. A value of 0.52 – an okra leaf value – had been used instead of the normal leaf value of 0.87. Updates to cultivar definitions have been included with this enhancement.
Testing of enhancements
Root Development
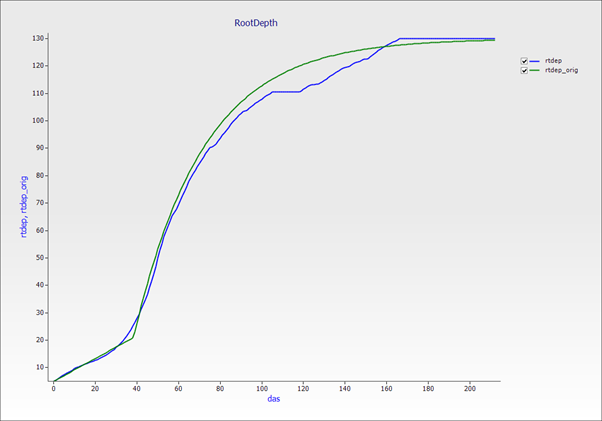
Using a standard Myall Vale crop with the profile set to 130cm.
The new functions (blue line) develop rooting depth in a very similar way to the original root depth routine (green line), but there is now much greater flexibility for adjusting the behaviour.
In this example, there is a drop in the crop’s assimilate production between 100 DAS and about 120 DAS, which is reflected in the pause in the root growth.
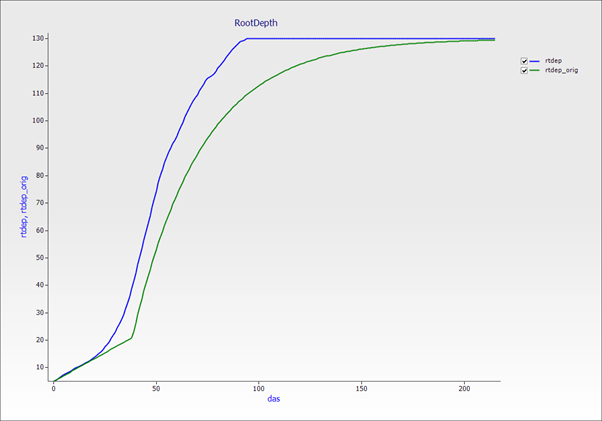
Reducing the rootLAcrit value allows the roots to grow before the boll load is applied. This would result in more available soil water for the plant as it explores more soil earlier.
Comparison against Stand-alone OZCOT

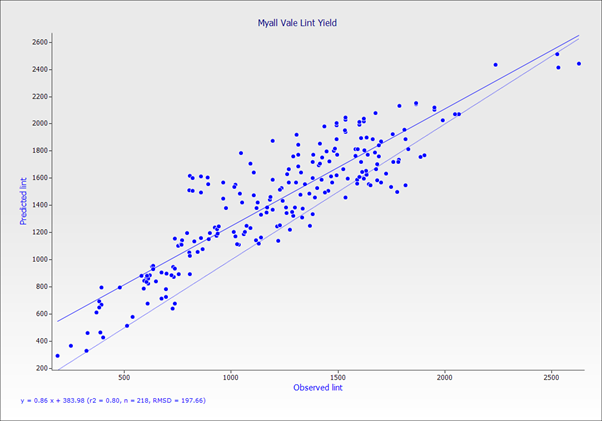
The enhancements have improved the APSIM-Cotton model when compared against previous versions for measures of R2, slope of the line and the RMSD.
When compared against the stand-alone Fortran version of OZCOT, its performance is also improved. There is a trend to consistenly over predict yield in APSIM-Cotton where OZCOT had a bias to over predict low yields and under predict high yields.
This bias is more evident in the ‘GAC’ series of experiments:

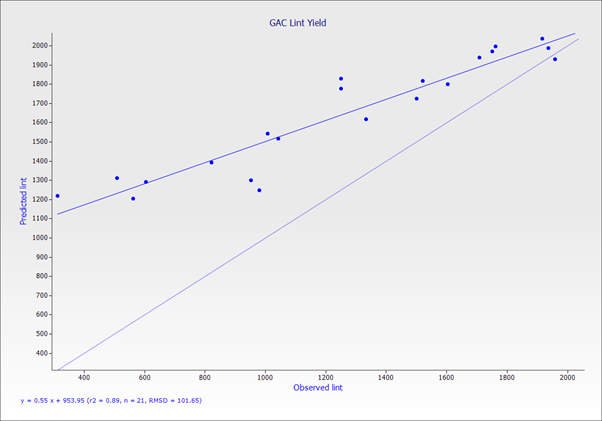
Again the R2 and RMSD have been improved, although the slope of the line has not been improved.
More recent data sets are still being worked on, but the initial indications are that the improvements are maintained.
References:
Hearn, A.B. 1994. OZCOT: A Simulation Model for Cotton Crop Management. Agricultural Systems 44: 257-299.