SoilN
Description
The SoilN module describes the dynamics of both carbon and nitrogen in soil.
The transformations considered in each layer are shown diagramatically in Figure 1.
The major difference from the CERES model is that the soil organic matter is divided into two pools ( biom and hum ),
the biom pool notionally representing the more labile, soil microbial biomass and microbial products, whilst hum comprises the rest of the soil organic matter.
The flows between the different pools are calculated in terms of carbon,
the corresponding nitrogen flows depending on the C:N ratio of the receiving pool.
The C:N ratios of the various pools are assumed to be constant through time;
C:N for biom is specified in the ini file,
whilst the C:N of hum is derived from the C:N ratio of the soil which is an input.

Figure 1. Diagram of transformations occuring in each soil layer
Decomposition of biom and hum pools are calculated as first-order processes with the rate constants being modified by factors involving soil temperature and moisture in the layer.
The fresh organic matter pool ( fom) is treated as in CERES-Maize (Jones and Kiniry, 1986), and its rate of decomposition also depends on a C:N ratio factor.
Mineralisation or immobilisation of mineral-N is determined as the balance between the release of nitrogen during decomposition and immobilisation during microbial synthesis and humification.
An inadequate supply of mineral-N to satisfy the immobilisation demand results in a slowing of the decomposition.
Both ammonium- and nitrate-N are available for immmobilisation, though ammonium-N is used preferentially.
Decomposition of any organic matter pool results in evolution of carbon dioxide to the atmosphere and transfers of carbon to the biom and hum pools.
The flows are defined in terms of efficiency coefficients, representing the proportion of carbon retained in the system,
and the fraction of the retained carbon that is synthesised into the biom pool (see Table 1 for parameter definitions and values).
When biom decomposes there is an internal cycling of carbon (microbes feeding on microbial products).
At initialisation, the amounts of hum carbon and biom carbon in each layer are calculated from inputs (oc, Finert, Fbiom).
So at initialisation,
total carbon = Fresh Organic Matter (FOM) carbon + organic carbon (nb. FOM carbon is initialised via Root Weight and C:N of Roots)
organic carbon (kg/ha) = biom_c + hum_c
nb. need to convert oc (%) to oc (kg/ha) by multiplying by layer depth and then doing a unit conversion
Step 1: Calculate inert_c
To allow for slower rates of decomposition of soil organic matter in the deeper soil layers,
part of the hum pool is considered to be non-susceptible to decomposition; this is specified as Finert, which typically will increase with depth.
The amount of the hum pool which is inert is determined by multiplying the organic carbon by Finert
inert_c = Finert x oc (in kg/ha)
Step 2: Calculate biom_c
Fbiom specifies the biom pool carbon as a fraction of the hum carbon that is subject to decomposition,
i.e. biom_c = Fbiom x (hum_c – inert_c)
since, hum_c = oc – biom_c
biom_c = (Fbiom x (oc – inert_c)) / (1 + Fbiom)
Step 3: Calculate hum_c
We can then get hum_c via,
hum_c = oc – biom_c
Table 1.
Model parameters determining the flows of carbon during the decomposition of the soil organic matter pools and surface residues
| Parameter | Value | Definition |
| mcn | 8.0 | C:N ratio of biom pool |
| ef_fom | 0.4 | efficiency of carbon retention when fom decomposes |
| fr_fom_biom | 0.9 | proportion of retained carbon from fom synthesised into biom |
| ef_biom | 0.4 | efficiency of carbon retention when biom decomposes |
| fr_biom_biom | 0.6 | proportion of retained carbon from biom resynthesised into biom |
| ef_hum | 0.4 | efficiency of carbon retention when hum decomposes |
| ef_res | 0.4 | efficiency of carbon retention when residues decompose |
| fr_res_biom | 0.9 | proportion of retained carbon from residues synthesised into biom |
| rd_carb | 0.2/day | maximum decomposition rate for carbohydrate-like C in fom. |
| rd_cell | 0.05/day | maximum decomposition rate for cellulose-like C in fom |
| rd_lign | 0.0095/day | maximum decomposition rate for lignin-like C in fom |
| rdbiom | 0.0081/day | maximum decomposition rate for biom |
| rdhum | 0.00015/day | maximum decomposition rate for hum |
Soil Temperature
Daily average soil temperature of each soil layer is calculated based on the soil temperature model of EPIC (Williams et al., 1984).
A sinusoidal function of day of year is assumed, with subsurface temperature changes lagging behind those at the soil surface.
The sinusoidal function is based on mean annual air temperature (tav), annual amplitude in mean monthly air temperature (amp) and latitude (included in met file).
The actual surface temperature is calculated from maximum and minimum temperatures, solar radiation and soil albedo.
Changes with depth are obtained from an exponential function of the ratio of depth and a temperature damping depth.
This damping depth is a function of the average bulk density of the soil and the amount of water above the lower limit.
Decomposition of Soil Organic Matter Pools
fom decomposition = Fpool (carbohydrate,cellulose or lignin fraction) x decay rate for a given fraction (rd_carb, rd_cell, rd_lign) x Soil water factor x Soil temperature factor x C:N ratio factor
biom decomposition = biom x rd_biom x Soil water factor x Soil temperature factor
hum decomposition = (hum – inert_C) x rd_hum x Soil water factor x Soil temperature factor
The factors affecting the individual decay rates are as follows:
(i) Soil Water
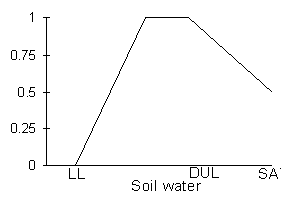
Figure 2. Water factor affecting mineralisation rates of the various soil organic matter pools.
(ii) Soil Temperature
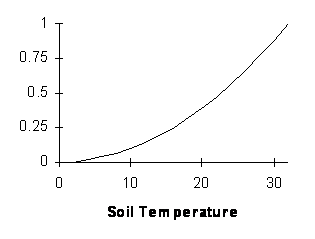
Figure 3. Temperature factor affecting mineralisation rates of the various soil organic matter pools.
(iii) C:N ratio
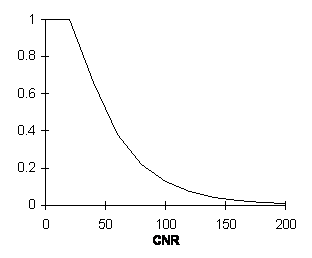
Figure 4. C:N ratio factor affecting mineralisation rate of soil FOM pools is calculated using a modified C:N ratio that includes the mineral nitrogen in the soil layer.
CNR = fom_C / (fom_N + min_N)
Nitrification
Nitrification is assumed to follow Michaelis-Menton kinetics (See Godwin and Jones 1991, though there is error in their equation 14).
potential rate = nitrification_pot x NH4 ppm / (NH4 ppm + NH4_at_half_pot)
where nitrification_pot (mg N/kg soil/ day) and NH4_at_half_pot (ppm) are specified in the SOILN ini file. Actual daily nitrification is reduced to allow for sub-optimal water, temperature and pH conditions.
nitrification rate = potential rate x min (water factor, temperature factor, pH factor)
(Unlike CERES, there is no provision for the potential rate of nitrification to change with time to represent a changing microbial population)
(i) Soil Water
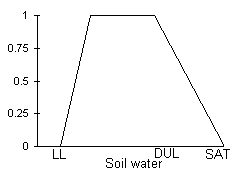
Figure 5. Water factor affecting the nitrification rate of ammonium in each soil layer.
(ii) Soil Temperature
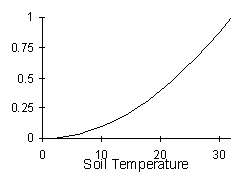
Figure 6. Temperature factor affecting the nitrification rate of ammonium in each soil layer.
(iii) pH
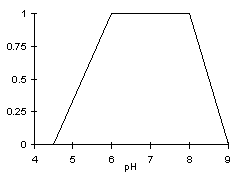
Figure 7. pH factor affecting the nitrification rate of ammonium in each soil layer.
Nitrous oxide from nitrification:
Note: Nitrous oxide predictions has been tested under a limited range of soil/climate and production systems
and although this testing produced sensible results there should still be a higher degree of user caution attached to the predictions.
Nitrous oxide (N2O) emission during nitrification (N2Onit) is calculated as a proportion (k2) of nitrified N (Li, 2000; Parton et al., 2001; Li et al., 2007):
N2Onit = k2 * Rnit
where Rnit is the rate of nitrification (kg N/ha/day).
A wide range of values have been adopted for k2 in agricultural soils in other models, potentially reflecting the uncertainty in the process resulting in N2O emissions during nitrification
- Li, 2000; Li et al., 2000; Parton et al., 2001; Li et al., 2007). Following Li et al.(2007) we adopt a value of 0.002, but acknowledge that values may be soil-specific.
- Li, C.S., 2000. Modeling trace gas emissions from agricultural ecosystems, Nutr. Cyc. Agroecosys. 58, 259-276.
- Li, C., Aber, J., Stange, J., Butterbach-Bahl, K., Papen, H., 2000. A process-oriented model of N2O and NO emissions from forest soils: 1 Model development. J. Geophys. Res. 105(D4). 4369–4384.
- Parton, W.J., Holland, E.A., Del Grosso, S.J., Hartman, M.D., Martin, R.E., Mosier, A.R., Ojima, D.S., Schimel, D.S., 2001. Generalized model for NOx and N2O emissions from soils. J. Geophys. Res. 106(D15),17403-17419.
- Li, Y., White, R.E., Chen, D.L., Zhang, J.B., Li, B.G., Zhang, Y.M., Huang, Y.F. Edis, R., 2007. A spatially referenced water and nitrogen management model (WNMM) for (irrigated) intensive cropping systems in the North China Plain. Ecol. Mod. 203, 395-423.
Denitrification
The code comes from CERES-Maize V1 and has not been modified to allow for biom_c.
Under most situations, simulated denitrification rates are small.
The sensibleness of the simulations where significant amounts of denitrification occur has not been verified.
denitrification rate = 0.0006 x NO 3 x active carbon ppm x water factor x temperature factor
where,
active carbon ppm = 0.0031 x (hum_C ppm + FOM_C ppm ) + 24.5
(i) Soil Water
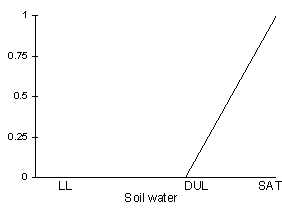
Figure 8. Water factor affecting the denitrification of nitrate in each soil layer.
(ii) Soil Temperature
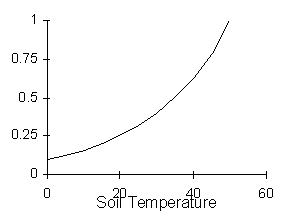
Figure 9. Temperature factor affecting the denitrification of nitrate in each soil layer.
Nitrous oxide from denitrification:
Note: Nitrous oxide predictions has been tested under a limited range of soil/climate and production systems
and although this testing produced sensible results there should still be a higher degree of user caution attached to the predictions.
Nitrous oxide (N2O) emission during denitrification (N2Odenit) is calculated by combining predictions of denitrification with the ratio of N2 to N2O emitted during denitrification predicted by the model of Del Grosso et al. (2000):
N2/N2Odenit = Max {(0.16 k1), (k1 exp(-0.8 NO3 ppm/CO2)) } * Max {0.1, ((1.5 WFPS) – 0.32) }
where,
k1 is related to gas diffusivity in soil at field capacity,
NO3ppm (µg/g) is the nitrate concentration of the soil on a dry weight basis, and
CO2 is the heterotrophic CO2 respiration (µgC/g soil / day).
- Del Grosso, S.J., Parton, W.J., Mosier, A.R., Ojima, D.S., Kulmala, A.E., Phongpan, S., 2000. General model for N2O and N-2 gas emissions from soils due to denitrification. Glob. Biogeochem. Cycl. 14, 1045-1060.
Urea hydrolysis:
potential hydrolysis fraction = -1.12 + 1.31xOC + 0.203xpH – 0.155xOCxpH
This fraction is bound between 0 and 1. For OC=1% and pH=7 the fraction=0.526
hydrolysis rate = Urea x potential hydrolysis fraction x min (temperature factor, water factor)
(i) Soil Water
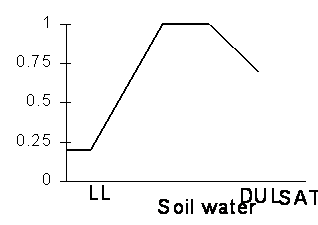
Figure 10. Water factor affecting the hydrolysis of urea in each soil layer.
(ii) Soil Temperature
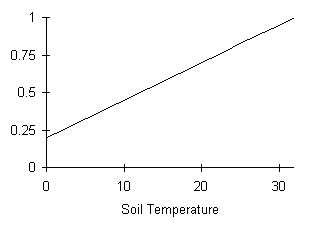
Figure 11. Temperature factor affecting hydrolysis of urea in each soil layer.
SoilN module actions
Reset
The reset action can be invoked to reset the module to the state specified within the module’s input data,
which includes the soil’s organic carbon components (biom and hum), nitrate, ammonium and urea N, and FOM (specified as root weight).
The Reset action is identical to the initialise action used by the simulation engine at the start of the simulation except that a description of the reinitialised state is not printed in the simulation summary file.
Where only mineral N concentrations need to be reinitialised the ‘set’ action is used (See below).
APSIM Manager Example:
[sample.manager.start_of_day]
! reinitialise soil nitrogen at the beginning of each sowing window
If day = 100 then
soiln2 reset
endif
Initialise
The initialise action has been replaced by the reset action (see above).
Set
The set action is used to reinitialise single mineral N pools within the module (Nitrate, Ammonium or Urea). Only the particular mineral pools are reset.
APSIM Manager Example:
[sample.manager.start_of_day]
! reinitialise soil mineral nitrogen at given date
If day = 100 then
soiln2 set no3 = 10 5 1 (kg/ha)
soiln2 set nh4 = 10 5 1 (kg/ha)
endif
or in terms of concentration
[sample.manager.start_of_day]
If day = 100 then
soiln2 set no3ppm = 1.0 1.0 1.0 (ppm)
soiln2 set nh4ppm = 1.0 1.0 1.0 (ppm)
endif
Summary Report
At initialisation, at series of tables and useful information is printed to the simulation summary file for perusal by the user.
These tables can be printed to the summary file at any point during the simulation as a detailed record of the system state at a particular time.
APSIM Manager Example:
[sample.manager.start_of_day]
! Print out a summary of module state to the summary file
If day = 100 then
soiln2 sum_report
endif
Incorporate FOM
Fresh organic matter can be incorporated into the soil using the incorp_fom action.
The amounts of FOM and FON are specified on a layered basis .
An optional FOM type can be specified to use any preset fractionations of FOM as specified in the module ini file.
A default fractionation is used if type is not specified.
FON content can be specified as either an amount or a C:N ratio.
APSIM Manager Example:
NOTE: actions must be specified as a single line in the manager file
If day = 100 then
soiln2 incorp_fom dlt_fom_type = manure, dlt_fom_wt = 100 50 0 (kg/ha), dlt_fom_n = 4 2 0 (kg/ha)
endif
or assuming that FOM is 40% carbon we can use a C:N ratio.
If day = 100 then
soiln2 incorp_fom dlt_fom_type = manure, dlt_fom_wt = 100 50 0 (kg/ha), dlt_fom_cnr = 10 10 0 (kg/ha)
endif
SoilN module outputs
| Name | Units | Description |
| no3 | kg/ha | amount of NO3 in each layer |
| no3ppm | ppm | concentration of NO3 in each layer |
| no3_min | ppm | minimum amount of NO3 allowed in each layer |
| nh4 | kg/ha | amount of NH4 in each layer |
| nh4ppm | ppm | concentration of NH4 in each layer |
| nh4_min | ppm | minimum amount of NH4 allowed in each layer |
| urea | kg/ha | amount of urea in each layer |
| fom_n | kg/ha | amount of N in FOM in each layer |
| hum_n | kg/ha | amount of humic N in each layer |
| biom_n | kg/ha | amount of biomass N in each layer |
| fom_c | kg/ha | amount of C in FOM in each layer |
| hum_c | kg/ha | amount of humic C in each layer |
| biom_c | kg/ha | amount of biomass C in each layer |
| carbon_tot | kg/ha | Total amount of C in each layer |
| nit_tot | kg/ha | Total amount of N in each layer |
| dlt_n_min | kg/ha | Today’s net N mineralisation in each layer from soil organic matter pools |
| dlt_n_min_res | kg/ha | Today’s net N mineralisation in each layer from surface residues |
| dlt_n_min_tot | kg/ha | Today’s net N mineralisation in each layer from soil organic matter pools and surface residues. |
| dnit | kg/ha | Today’s denitrification loss for each layer |
| dlt_c_loss_in_sed | kg/ha | Loss of C in sediment due to erosion |
| dlt_n_loss_in_sed | kg/ha | Loss of N in sediment due to erosion |
